

Question: *** Drink mix concentrations and absorbances for constructing a standard curve Concentration (MM) Concentration (M) Absorbance 160 0.16 1,46 Sample 1 180 0.18 1.63 Sample
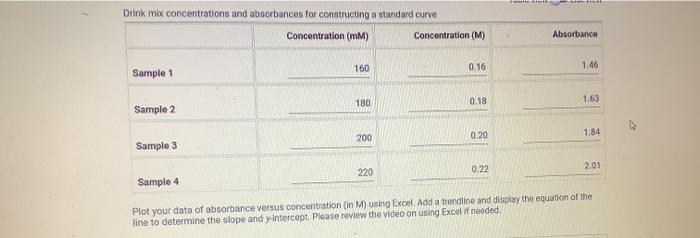
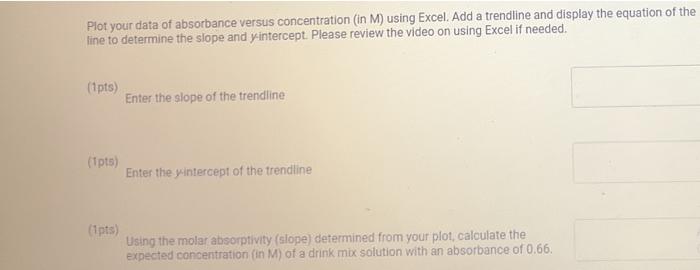
*** Drink mix concentrations and absorbances for constructing a standard curve Concentration (MM) Concentration (M) Absorbance 160 0.16 1,46 Sample 1 180 0.18 1.63 Sample 2 200 0.20 1.84 Sample 3 220 2.01 0.22 Sample 4 Plot your data of absorbance versus concentration (in M) using Excel. Add a trendline and display the equation of the line to determine the slope and y-intercopt. Please review the video on using Excel if needed Plot your data of absorbance versus concentration (in M) using Excel. Add a trendline and display the equation of the fine to determine the slope and y-intercept. Please review the video on using Excel if needed. (1pts) Enter the slope of the trendline (tts) Enter the intercept of the trendline Using the molar absorptivity (slope) determined from your plot, caloulate the expected concentration (in M) of a drink mix solution with an absorbance of 0.66
Step by Step Solution
There are 3 Steps involved in it

Get step-by-step solutions from verified subject matter experts