

Question: Driver File: # Driver_Q1.R # This is the Driver file # Students should implement the following function in Solution_Q1.R: # genMCMC: generates the MCMC chain
Driver File:
# Driver_Q1.R # This is the Driver file
# Students should implement the following function in Solution_Q1.R: # genMCMC: generates the MCMC chain
#------------------------------------------------------------------------------- # Optional generic preliminaries: graphics.off() # This closes all of R's graphics windows. rm(list=ls()) # Careful! This clears all of R's memory!
#------------------------------------------------------------------------------- # Read the data myData = read.csv("glucoseData.csv")
#------------------------------------------------------------------------------- # Load the relevant model into R's working memory: source("Solution_Q1.R")
#------------------------------------------------------------------------------- # Optional: Specify filename root and graphical format for saving output. # Otherwise specify as NULL or leave saveName and saveType arguments # out of function calls. fileNameRoot = "glucose_" graphFileType = "pdf"
#------------------------------------------------------------------------------- # Generate the MCMC chain: mcmcCoda = genMCMC( data=myData , numSavedSteps=11000 , saveName=fileNameRoot , thinSteps=20 )
#------------------------------------------------------------------------------- # Display diagnostics of chain, for specified parameters: for ( parName in c( "thetaA","thetaB","thetaC","omegaA","omegaB", "omegaC") ) { diagMCMC( codaObject=mcmcCoda , parName=parName , saveName=fileNameRoot , saveType=graphFileType ) }
#------------------------------------------------------------------------------- # Display posterior information: plotMCMC( mcmcCoda , data=myData , compVal=NULL , diffCList=list( c("omegaA","omegaB") , c("omegaA","omegaC") , c("omegaB","omegaC") ) , diffSList=list( c("thetaA","thetaB") , c("thetaA","thetaC") , c("thetaB","thetaC") ) , compValDiff=0.0, saveName=fileNameRoot , saveType=graphFileType ) #-------------------------------------------------------------------------------
Solution File:
# Solution_Q1.R # This is the Solution file
# https://sites.google.com/site/doingbayesiandataanalysis/
# Students should complete the following function in Solution_Q1.R: # genMCMC: generates the MCMC chain
source("DBDA2E-utilities.R")
#=============================================================================== genMCMC = function( data, numSavedSteps=50000 , saveName=NULL , thinSteps=1 , runjagsMethod=runjagsMethodDefault , nChains=nChainsDefault ) { require(rjags) require(runjags) #----------------------------------------------------------------------------- # Implement me #----------------------------------------------------------------------------- # RUN THE CHAINS parameters = c( "thetaA", "thetaB", "thetaC", "omegaA", "omegaB", "omegaC", "kappaA", "kappaB", "kappaC") adaptSteps = 500 # Number of steps to adapt the samplers burnInSteps = 500 # Number of steps to burn-in the chains useRunjags = TRUE if ( useRunjags ) { runJagsOut
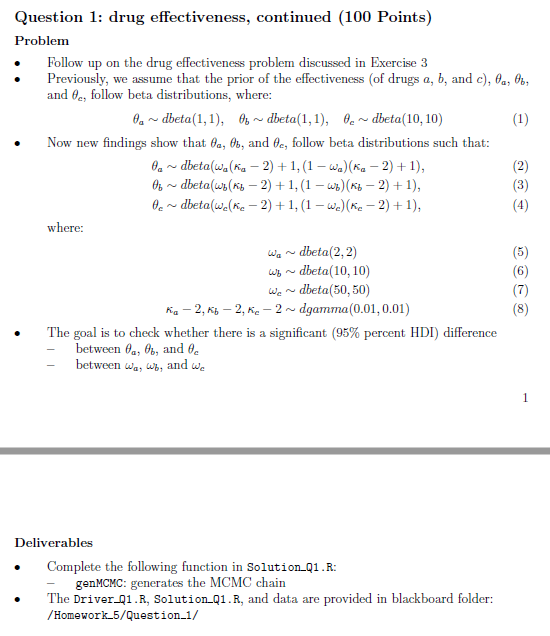
#=============================================================================== plotMCMC = function( codaSamples , data , compVal=0.5 , rope=NULL , diffSList=NULL , diffCList=NULL , compValDiff=0.0 , ropeDiff=NULL , saveName=NULL , saveType="jpg" ) { # Now plot the posterior: mcmcMat = as.matrix(codaSamples,chains=TRUE) chainLength = NROW( mcmcMat ) # kappa: parNames = sort(grep("kappa",colnames(mcmcMat),value=TRUE)) nPanels = length(parNames) nCols = 4 nRows = ceiling(nPanelsCols) openGraph(width=2.5*nCols,height=2.0*nRows) par( mfcol=c(nRows,nCols) ) par( mar=c(3.5,1,3.5,1) , mgp=c(2.0,0.7,0) ) #xLim = range( mcmcMat[,parNames] ) xLim=quantile(mcmcMat[,parNames],probs=c(0.000,0.995)) #mainLab = c(levels(myData[[cName]]),"Overall") mainIdx = 0 for ( parName in parNames ) { mainIdx = mainIdx+1 postInfo = plotPost( mcmcMat[,parName] , compVal=compVal , ROPE=rope , xlab=bquote(.(parName)) , cex.lab=1.25 , main=NULL , cex.main=1.5 , xlim=xLim , border="skyblue" ) } if ( !is.null(saveName) ) { saveGraph( file=paste(saveName,"Kappa",sep=""), type=saveType) } # omega: parNames = sort(grep("omega",colnames(mcmcMat),value=TRUE)) nPanels = length(parNames) nCols = 4 nRows = ceiling(nPanelsCols) openGraph(width=2.5*nCols,height=2.0*nRows) par( mfcol=c(nRows,nCols) ) par( mar=c(3.5,1,3.5,1) , mgp=c(2.0,0.7,0) ) #xLim = range( mcmcMat[,parNames] ) xLim=quantile(mcmcMat[,parNames],probs=c(0.001,0.999)) #mainLab = c(levels(myData[[cName]]),"Overall") mainIdx = 0 for ( parName in parNames ) { mainIdx = mainIdx+1 postInfo = plotPost( mcmcMat[,parName] , compVal=compVal , ROPE=rope , xlab=bquote(.(parName)) , cex.lab=1.25 , main=NULL , cex.main=1.5 , xlim=xLim , border="skyblue" ) } if ( !is.null(saveName) ) { saveGraph( file=paste(saveName,"Omega",sep=""), type=saveType) } # Plot individual omega's and differences: if ( !is.null(diffCList) ) { for ( compIdx in 1:length(diffCList) ) { diffCVec = diffCList[[compIdx]] Nidx = length(diffCVec) openGraph(width=2.5*Nidx,height=2.0*Nidx) par( mfrow=c(Nidx,Nidx) ) xLim = range(c( compVal, rope, mcmcMat[,diffCVec] )) for ( t1Idx in 1:Nidx ) { for ( t2Idx in 1:Nidx ) { parName1 = diffCVec[t1Idx] parName2 = diffCVec[t2Idx] if ( t1Idx > t2Idx) { # plot.new() # empty plot, advance to next par( mar=c(3,3,3,1) , mgp=c(2.0,0.7,0) , pty="s" ) nToPlot = 700 ptIdx = round(seq(1,chainLength,length=nToPlot)) plot ( mcmcMat[ptIdx,parName2] , mcmcMat[ptIdx,parName1] , cex.main=1.25 , cex.lab=1.25 , xlab=diffCVec[t2Idx] , ylab=diffCVec[t1Idx] , col="skyblue" ) abline(0,1,lty="dotted") } else if ( t1Idx == t2Idx ) { par( mar=c(3,1.5,3,1.5) , mgp=c(2.0,0.7,0) , pty="m" ) postInfo = plotPost( mcmcMat[,parName1] , compVal=compVal , ROPE=rope , cex.main=1.25 , cex.lab=1.25 , xlab=bquote(.(parName1)) , main=diffCVec[t1Idx] , xlim=xLim ) } else if ( t1Idx t2Idx) { # plot.new() # empty plot, advance to next par( mar=c(3,3,3,1) , mgp=c(2.0,0.7,0) , pty="s" ) nToPlot = 700 ptIdx = round(seq(1,chainLength,length=nToPlot)) plot ( mcmcMat[ptIdx,parName2] , mcmcMat[ptIdx,parName1] , cex.main=1.25 , cex.lab=1.25 , xlab=diffSVec[t2Idx] , ylab=diffSVec[t1Idx] , col="skyblue" ) abline(0,1,lty="dotted") } else if ( t1Idx == t2Idx ) { par( mar=c(3,1.5,3,1.5) , mgp=c(2.0,0.7,0) , pty="m" ) postInfo = plotPost( mcmcMat[,parName1] , compVal=compVal , ROPE=rope , cex.main=1.25 , cex.lab=1.25 , xlab=bquote(.(parName1)) , main=diffSVec[t1Idx] , xlim=xLim ) } else if ( t1Idx Question 1: drug effectiveness, continued (100 Points) Problem Follow up on the drug effectiveness problem discussed in Exercise 3 Previously, we assume that the prior of the effectiveness (of drugs a, b, and c), , and follow beta distributions, where: 0a dbeta(1,1), b~dbeta(1,1), c~dbeta (10, 10) Now, new findings show that , 6, and le, follow beta distributions such that: dbeta(w(K 21,(1-wa) (Ka -2)1), 0b dbeta((2)1,(1-u) (K21), e~dbeta(w(ke 2),1-w)(e21), 3 where: wdbeta(2,2) w dbeta 10, 10) wedbeta(50,50) Ka-2,K-2, K 2~dgamma(0.01,0.01) The goal is to check whether there is a significant (95% percent HDD difference between e.. ., and between w" , and we Deliverables Complete the following function in Solution-Q1.R: genMCMC: generates the MCMC chain The Driver-01.R, Solution1.R, and data are provided in blackboard folder: /Homework -5/Questi on-1/ Question 1: drug effectiveness, continued (100 Points) Problem Follow up on the drug effectiveness problem discussed in Exercise 3 Previously, we assume that the prior of the effectiveness (of drugs a, b, and c), , and follow beta distributions, where: 0a dbeta(1,1), b~dbeta(1,1), c~dbeta (10, 10) Now, new findings show that , 6, and le, follow beta distributions such that: dbeta(w(K 21,(1-wa) (Ka -2)1), 0b dbeta((2)1,(1-u) (K21), e~dbeta(w(ke 2),1-w)(e21), 3 where: wdbeta(2,2) w dbeta 10, 10) wedbeta(50,50) Ka-2,K-2, K 2~dgamma(0.01,0.01) The goal is to check whether there is a significant (95% percent HDD difference between e.. ., and between w" , and we Deliverables Complete the following function in Solution-Q1.R: genMCMC: generates the MCMC chain The Driver-01.R, Solution1.R, and data are provided in blackboard folder: /Homework -5/Questi on-1/
Step by Step Solution
There are 3 Steps involved in it

Get step-by-step solutions from verified subject matter experts