

Question: Drivers prices An amusement park studied methods for decreasing the waiting time (minutes) for rides by loading and unloading riders more efficiently. Two alternative loading/unloading
Drivers prices
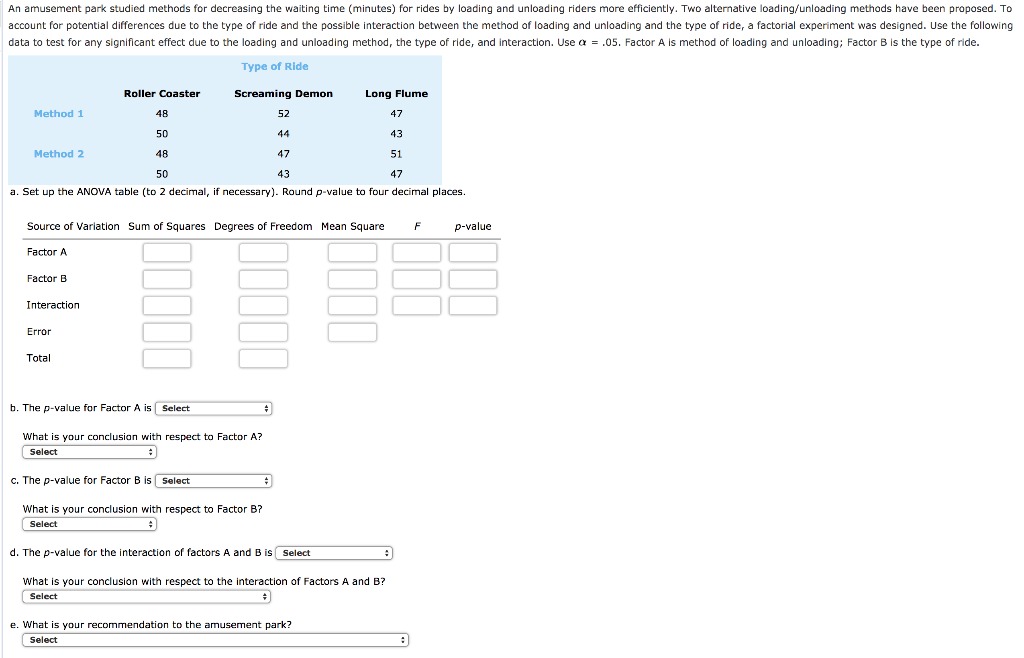
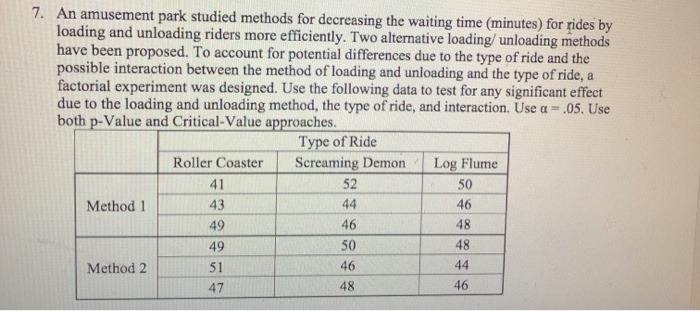
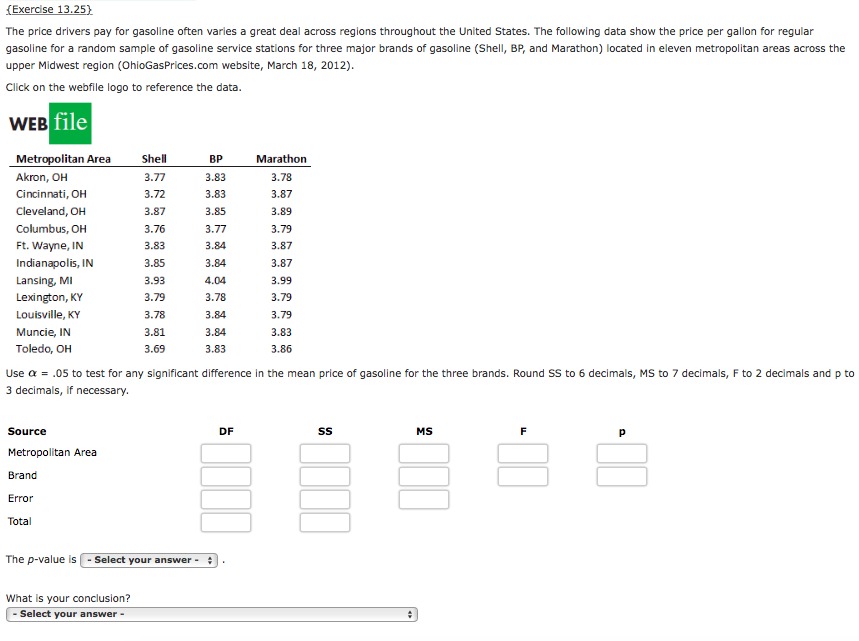
An amusement park studied methods for decreasing the waiting time (minutes) for rides by loading and unloading riders more efficiently. Two alternative loading/unloading methods have been proposed. To account for potential differences due to the type of ride and the possible interaction between the method of loading and unloading and the type of ride, a factorial experiment was designed. Use the following data to test for any significant effect due to the loading and unloading method, the type of ride, and interaction. Use a = .05. Factor A is method of loading and unloading; Factor B is the type of ride. Type of Ride Roller Coaster Screaming Demon Long Flume Method 1 48 52 47 50 44 43 Method 2 48 47 51 50 43 47 a. Set up the ANOVA table (to 2 decimal, if necessary). Round p-value to four decimal places. Source of Variation Sum of Squares Degrees of Freedom Mean Square F p-value Factor A Factor B Interaction Error Total b. The p-value for Factor A is |Select What is your conclusion with respect to Factor A? Select C. The p-value for Factor B is | Select What is your conclusion with respect to Factor B? Select d. The p-value for the interaction of factors A and B is | Select What is your conclusion with respect to the interaction of Factors A and B? Select e. What is your recommendation to the amusement park? Select7. An amusement park studied methods for decreasing the waiting time (minutes) for rides by loading and unloading riders more efficiently. Two alternative loading/ unloading methods have been proposed. To account for potential differences due to the type of ride and the possible interaction between the method of loading and unloading and the type of ride, a factorial experiment was designed. Use the following data to test for any significant effect due to the loading and unloading method, the type of ride, and interaction. Use a = .05. Use both p-Value and Critical-Value approaches. Type of Ride Roller Coaster Screaming Demon Log Flume 41 52 50 Method 1 43 44 46 49 46 48 49 50 48 Method 2 51 46 44 47 48 46{Exercise 13.25) The price drivers pay for gasoline often varies a great deal across regions throughout the United States. The following data show the price per gallon for regular gasoline for a random sample of gasoline service stations for three major brands of gasoline (Shell, BP, and Marathon) located in eleven metropolitan areas across the upper Midwest region (OhioGasPrices.com website, March 18, 2012). Click on the webfile logo to reference the data. WEB file Metropolitan Area Shell BP Marathon Akron, OH 3.77 3.83 3.78 Cincinnati, OH 3.72 3.83 3.87 Cleveland, OH 3.87 3.85 3.89 Columbus, OH 3.76 3.77 3.79 Ft. Wayne, IN 3.83 3.84 3.87 Indianapolis, IN 3.85 3.84 3.87 Lansing, MI 3.93 4.04 3.99 Lexington, KY 3.79 3.78 3.79 Louisville, KY 3.78 3.84 3.79 Muncie, IN 3.81 3.84 3.83 Toledo, OH 3.69 3.83 3.86 Use o = .05 to test for any significant difference in the mean price of gasoline for the three brands. Round SS to 6 decimals, MS to 7 decimals, F to 2 decimals and p to 3 decimals, If necessary. Source DE MS D Metropolitan Area Brand Error Total The p-value Is [ - Select your answer - ;] . What Is your conclusion? - Select your
Step by Step Solution
There are 3 Steps involved in it

Get step-by-step solutions from verified subject matter experts