

Question: drop down windows below 4. Expected dividends as a basis for stock values The following graph shows the value of a stock's dividends over time.
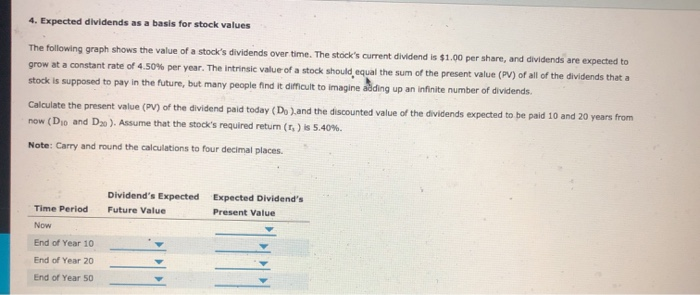
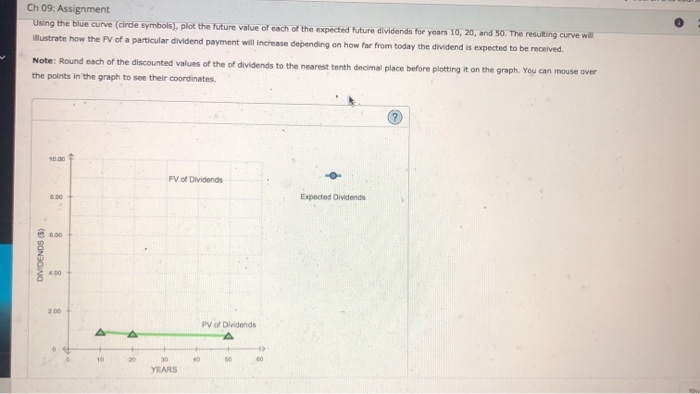
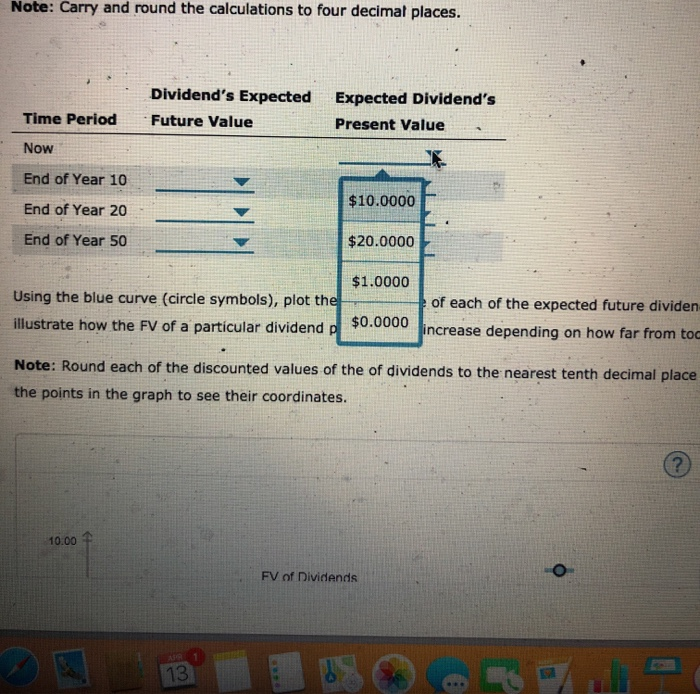
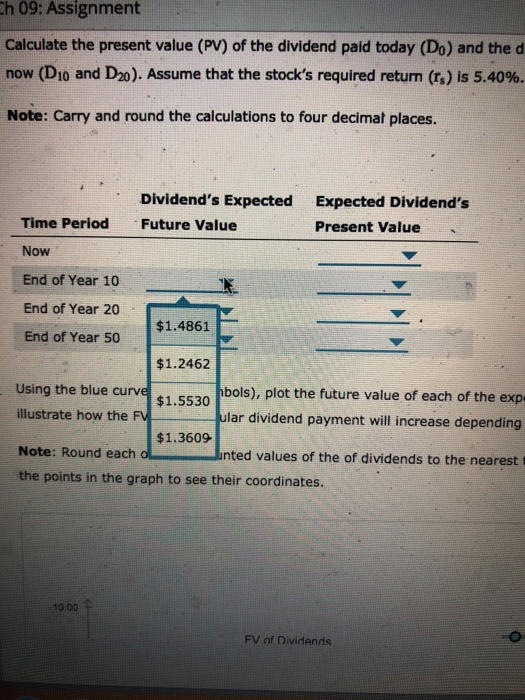
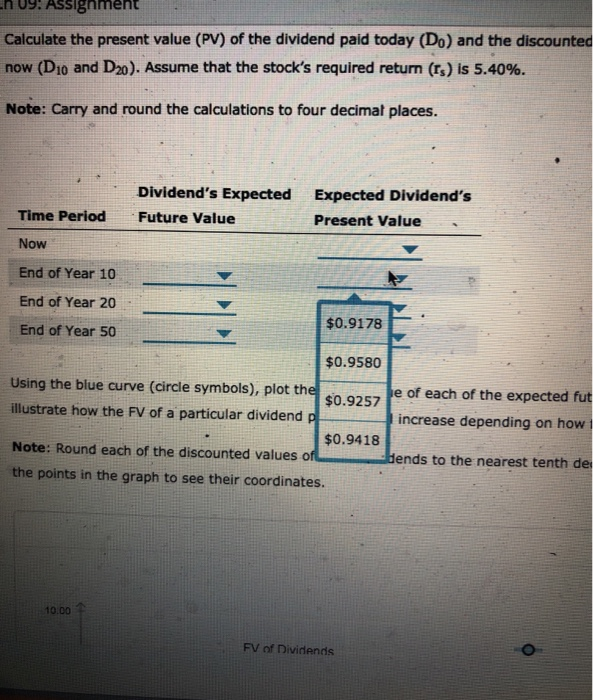
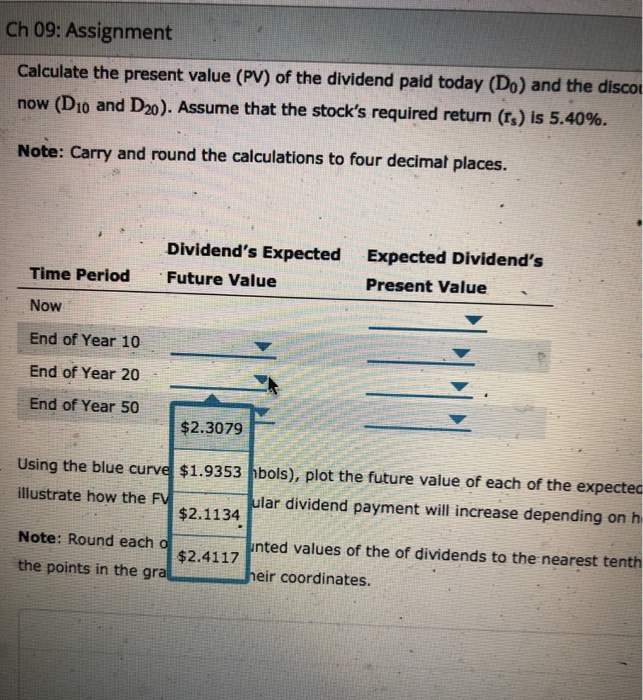

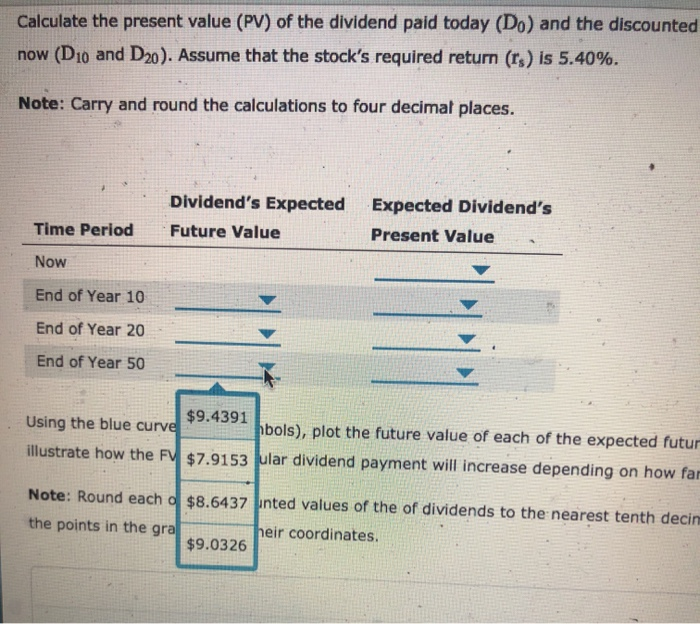

4. Expected dividends as a basis for stock values The following graph shows the value of a stock's dividends over time. The stock's current dividend is $1.00 per share, and dividends are expected to grow at a constant rate of 4.50% per year. The intrinsic value of a stock should equal the sum of the present value (PV) of all of the dividends that a stock is supposed to pay in the future, but many people find it difficult to imagine adding up an infinite number of dividends. Calculate the present value (PV) of the dividend paid today (De) and the discounted value of the dividends expected to be paid 10 and 20 years from now (Dio and Do ). Assume that the stock's required return (s) is 5.40%. Note: Carry and round the calculations to four decimal places Dividend's Expected Future Value Expected Dividend's Present Value Time Period Now End of Year 10 End of Year 20 End of Year 50 Ch 09: Assignment Using the blue curve (cirde symbols), plot the future value of each of the expected future dividends for years 10, 20, and 50. The resulting curve will llustrate how the PV of a particular dividend payment will increase depending on how far from today the dividend is expected to be received Note: Round each of the discounted values of the of dividends to the nearest tenth decimal place before plotting it on the graph. You can mouse over the points in the graph to see their coordinates. Expected Dividends DIVIDENDS (5) Pro Dividends YLLARS Note: Carry and round the calculations to four decimal places. Dividend's Expected Future Value Expected Dividend's Present Value Time Period Now $10.0000 End of Year 10 End of Year 20 End of Year 50 $20.0000 $1.0000 Using the blue curve (circle symbols), plot the illustrate how the FV of a particular dividend pl $0.0000 of each of the expected future dividen increase depending on how far from toc Note: Round each of the discounted values of the of dividends to the nearest tenth decimal place the points in the graph to see their coordinates. 10.00 + FV of Dividends Ch 09: Assignment Calculate the present value (PV) of the dividend paid today (D.) and the d now (D10 and D20). Assume that the stock's required return (rs) is 5.40%. Note: Carry and round the calculations to four decimal places. Dividend's Expected Expected Dividend's Time Period Future Value Present Value Now End of Year 10 End of Year 20 $1.4861 End of Year 50 $1.2462 Using the blue curve ta 5520 hbols), plot the future value of each of the exp illustrate how the FV ular dividend payment will increase depending $1.3609 Note: Round each ol Junted values of the of dividends to the nearest the points in the graph to see their coordinates. 10.00 FV of Dividends n09: Assignment Calculate the present value (PV) of the dividend paid today (Do) and the discounted now (Dio and D20). Assume that the stock's required return (Es) is 5.40%. Note: Carry and round the calculations to four decimal places. Dividend's Expected Expected Dividend's Time Period Future Value Present Value Now End of Year 10 End of Year 20 $0.9178 End of Year 50 $0.9580 Using the blue curve (Circle symbols), plot the 252 Je of each of the expected fut illustrate how the FV of a particular dividend pl increase depending on how $0.9418 Note: Round each of the discounted values of bends to the nearest tenth de the points in the graph to see their coordinates. 10.00 FV of Dividends Ch 09: Assignment Calculate the present value (PV) of the dividend paid today (Do) and the discou now (D10 and D20). Assume that the stock's required return (s) is 5.40%. Note: Carry and round the calculations to four decimal places. Dividend's Expected Future Value Time Period Now Expected Dividend's Present Value End of Year 10 End of Year 20 End of Year 50 $2.3079 Using the blue curve $1.9353 bols), plot the future value of each of the expected illustrate how the FV ular dividend payment will increase depending on h Note: Round each o the points in the gra unted values of the of dividends to the nearest tenth heir coordinates. 09: Assignment alculate the present value (PV) of the dividend paid today (Do) and the discounted value of th OW (D10 and D20). Assume that the stock's required return (r) is 5.40%. ote: Carry and round the calculations to four decimal places. Dividend's Expected Future Value Expected Dividend's Present Value Time Period Now End of Year 10 End of Year 20 End of Year 50 $0.8793 Using the blue curve (circle symbols), plot the $0.8424 pe of each of the expected future dividends illustrate how the FV of a particular dividend pl increase depending on how far from toda 1 $0.8497 Note: Round each of the discounted values of i Hends to the nearest tenth decimal place bu $0.8644. the points in the graph to see their coordinate 10.00 Calculate the present value (PV) of the dividend paid today (D) and the discounted now (D10 and D20). Assume that the stock's required return (rs) is 5.40%. Note: Carry and round the calculations to four decimal places. Dividend's Expected Future Value Time Period Expected Dividend's Present Value Now End of Year 10 End of Year 20 End of Year 50 Using the blue curve illustrate how the F $9.4391 hbols), plot the future value of each of the expected futur $7.9153 ular dividend payment will increase depending on how far Note: Round each d $8.6437 unted values of the of dividends to the nearest tenth decin the points in the gra heir coordinates $9.0326 Calculate the present value (PV) of the dividend paid today (Do) and the discounted now (D10 and D20). Assume that the stock's required return (rs) is 5.40%. Note: Carry and round the calculations to four decimal places. Dividend's Expected Future Value Time Period Expected Dividend's Present Value Now End of Year 10 End of Year 20 End of Year 50 Using the blue curve (circle symbols), plot the illustrate how the FV of a particular dividend pl$0.6457 be of each of the expected future increase depending on how far Note: Round each of the discounted values of $0.6513 pends to the nearest tenth decim the points in the graph to see their coordinate $0.6569 10.00+
Step by Step Solution
There are 3 Steps involved in it

Get step-by-step solutions from verified subject matter experts