

Question: Drop-down 1 Options: simulation analysis , sensitivity analysis , or scenario analysis Drop-down 2 Options: varies or stays the same 5. Methods of analyzing risk
Drop-down 1 Options: simulation analysis, sensitivity analysis, or scenario analysis
Drop-down 2 Options: varies or stays the same
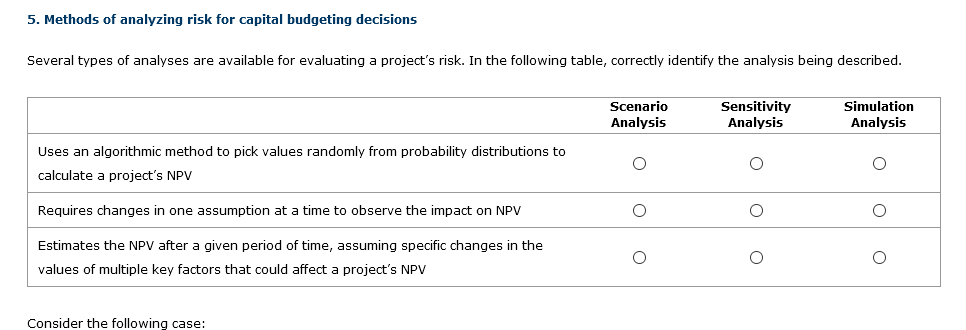
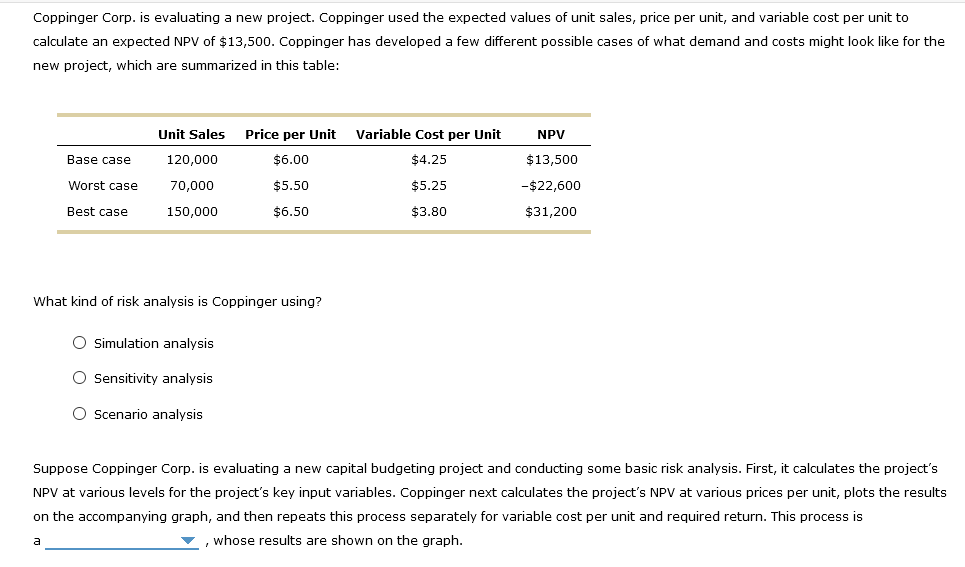
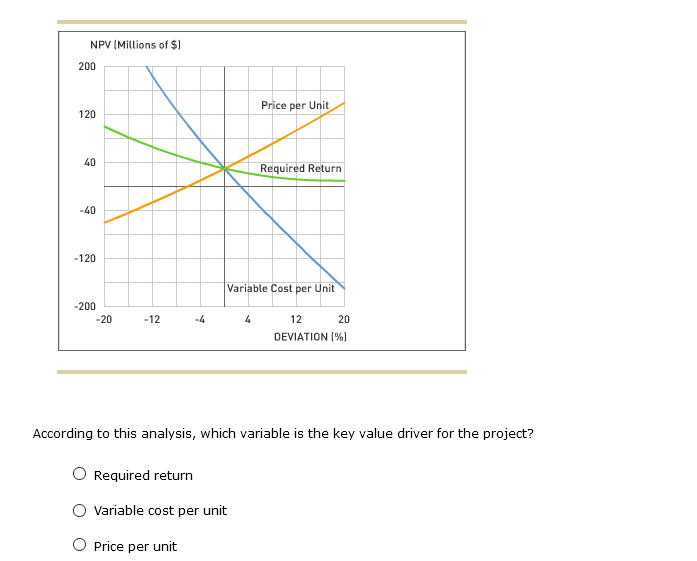
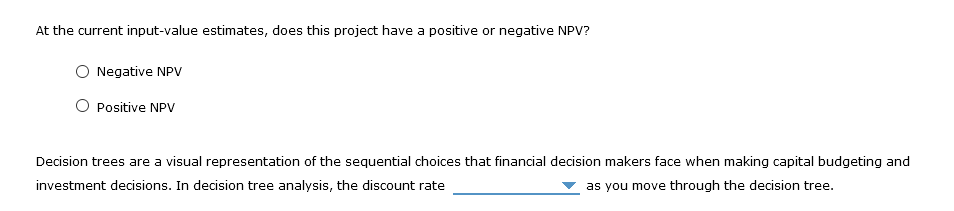
5. Methods of analyzing risk for capital budgeting decisions Several types of analyses are available for evaluating a project's risk. In the following table, correctly identify the analysis being described. Scenario Analysis Sensitivity Analysis Simulation Analysis Uses an algorithmic method to pick values randomly from probability distributions to calculate a project's NPV Oo Requires changes in one assumption at a time to observe the impact on NPV O O O Estimates the NPV after a given period of time, assuming specific changes in the values of multiple key factors that could affect a project's NPV O o Consider the following case: Coppinger Corp. is evaluating a new project. Coppinger used the expected values of unit sales, price per unit, and variable cost per unit to calculate an expected NPV of $13,500. Coppinger has developed a few different possible cases of what demand and costs might look like for the new project, which are summarized in this table: Unit Sales Price per Unit NPV Variable Cost per Unit $4.25 Base case 120,000 $6.00 $13,500 Worst case 70,000 $5.50 $5.25 -$22,600 Best case 150,000 $6.50 $3.80 $31,200 What kind of risk analysis is Coppinger using? O Simulation analysis O Sensitivity analysis O Scenario analysis Suppose Coppinger Corp. is evaluating a new capital budgeting project and conducting some basic risk analysis. First, it calculates the project's NPV at various levels for the project's key input variables. Coppinger next calculates the project's NPV at various prices per unit, plots the results on the accompanying graph, and then repeats this process separately for variable cost per unit and required return. This process is , whose results are shown on the graph. a NPV (Millions of $] 200 Price per Unit 120 40 Required Return -40 -120 Variable Cost per Unit -200 -20 -12 -4 4 12 20 DEVIATION (%) According to this analysis, which variable is the key value driver for the project? Required return O Variable cost per unit Price per unit At the current input-value estimates, does this project have a positive or negative NPV? O Negative NPV O Positive NPV Decision trees are a visual representation of the sequential choices that financial decision makers face when making capital budgeting and investment decisions. In decision tree analysis, the discount rate as you move through the decision tree
Step by Step Solution
There are 3 Steps involved in it

Get step-by-step solutions from verified subject matter experts