

Question: Drop-down options to b. Drop-down options to e. Analyzing Inventory Levels and Write-downs Quarterly data for Nvidia Inc. for the most recent 10 quarters follows

Drop-down options to b.
Drop-down options to e.
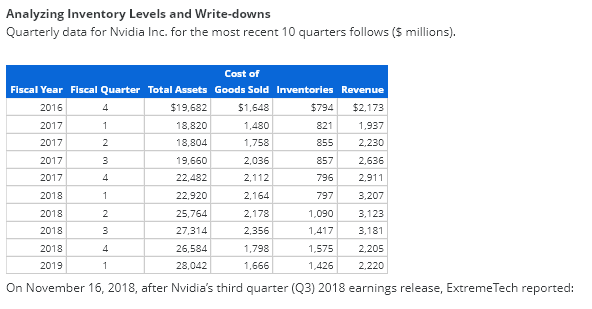
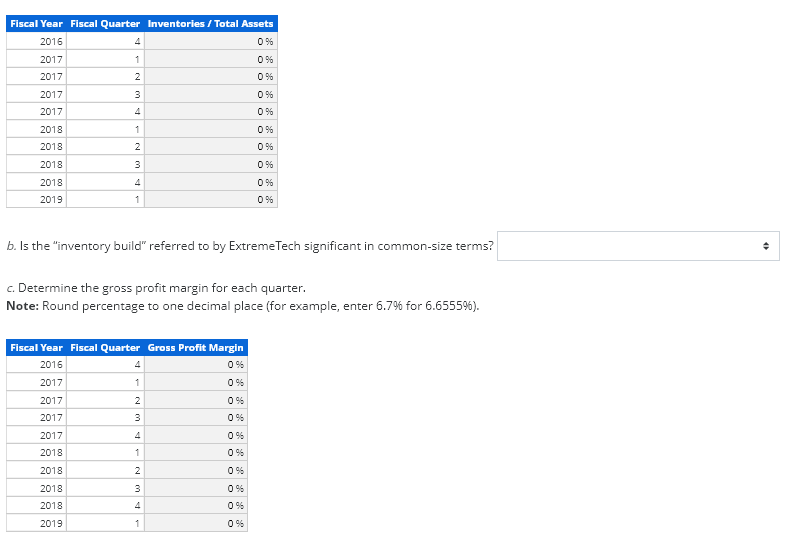
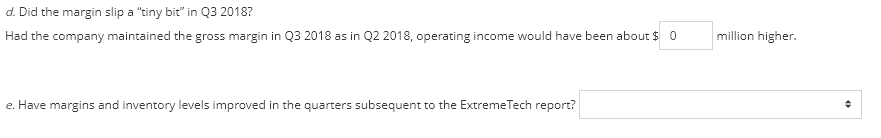
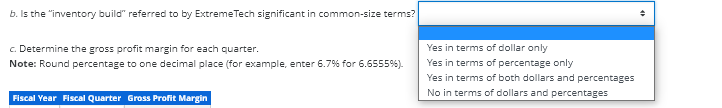
Analyzing Inventory Levels and Write-downs Quarterly data for Nvidia Inc. for the most recent 10 quarters follows (5 millions). Cost of Fiscal Year Fiscal Quarter Total Assets Goods Sold Inventories Revenue 2016 4 $19.682 $1,648 $794 $2,173 2017 1 18,820 1,480 821 1,937 2017 2 18,804 1,758 855 2.230 2017 3 19,660 2,036 857 2,636 2017 4 22,482 2,112 796 2.911 2018 1 22,920 2,164 797 3,207 2018 2 25,764 2,178 1,090 3,123 2018 3 27,314 2,356 1,417 3,181 2018 4 26,584 1,798 1.575 2,205 2019 1 28,042 1,666 1,426 2.220 On November 16, 2018, after Nvidia's third quarter (Q3) 2018 earnings release, ExtremeTech reported: Nvidia stocks plummeted on Friday after the company released its earnings report. The company has, as of this writing, lost about 16 percent of its previous valuation. But what happens to a company after it reports earnings doesn't always make sense from a technical perspective. Nvidia's stock has taken a hammering today for basically having a weak Q3. Revenue in Nvidia's fiscal year Q3 2019 (Nvidia's calendar runs a year ahead of the actual physical date) was up significantly compared with the same time last year, but flat in Q3 compared with Q2. Nvidia's margin slipped a tiny bit but it's the company's inventory build that has analysts worried. Nvidia is currently holding $1.417 B in product, up from $796 M in January 2018 and $1.09 B in Q2 2018. Nvidia blames this problem entirely on the decline of the cryptography market and has stated it will ship no new midrange cards to market through Q4 to give the channel time to work through the excess inventory build-up. a. Calculate the inventory as a percent of total assets. Note: Round percentage to one decimal place (for example, enter 6.7% for 6.65559). Fiscal Year Fiscal Quarter Inventories/Total Assets 2016 4 0 % 2017 1 09 2017 2 0% 2017 3 09 2017 4 09 2018 1 09 2018 2 09 2018 3 096 4 096 2018 2019 1 09 b. Is the "inventory build" referred to by Extreme Tech significant in common-size terms? c. Determine the gross profit margin for each quarter. Note: Round percentage to one decimal place (for example, enter 6.7% for 6.655596). Fiscal Year Fiscal Quarter Gross Profit Margin 2016 4 0 % 2017 1 09 2017 2 0 % 2017 3 096 2017 4 095 2018 1 0 % 2018 2 0 % 2018 3 096 2018 4 095 2019 1 0 % d. Did the margin slip a "tiny bit" in Q3 2018? Had the company maintained the gross margin in Q3 2018 as in Q2 2018, operating income would have been about $o million higher. e. Have margins and inventory levels improved in the quarters subsequent to the ExtremeTech report? b. Is the "inventory build" referred to by Extreme Tech significant in common-size terms? c. Determine the gross profit margin for each quarter. Note: Round percentage to one decimal place (for example, enter 6.7% for 5.555595). Yes in terms of dollar only Yes in terms of percentage only Yes in terms of both dollars and percentages No in terms of dollars and percentages Fiscal Year Fiscal Quarter Gross Profit Margin e. Have margins and inventory levels improved in the quarters subsequent to the ExtremeTech report? Results improved in all subsequent quarters Results worsened in all subsequent quarters Results in subsequent periods were mixed
Step by Step Solution
There are 3 Steps involved in it

Get step-by-step solutions from verified subject matter experts