

Question: DSP Home Work 3 (Return date: 07/01/2021) Read a sound file (may be this is a music file) in matlab and detect some frequency bands
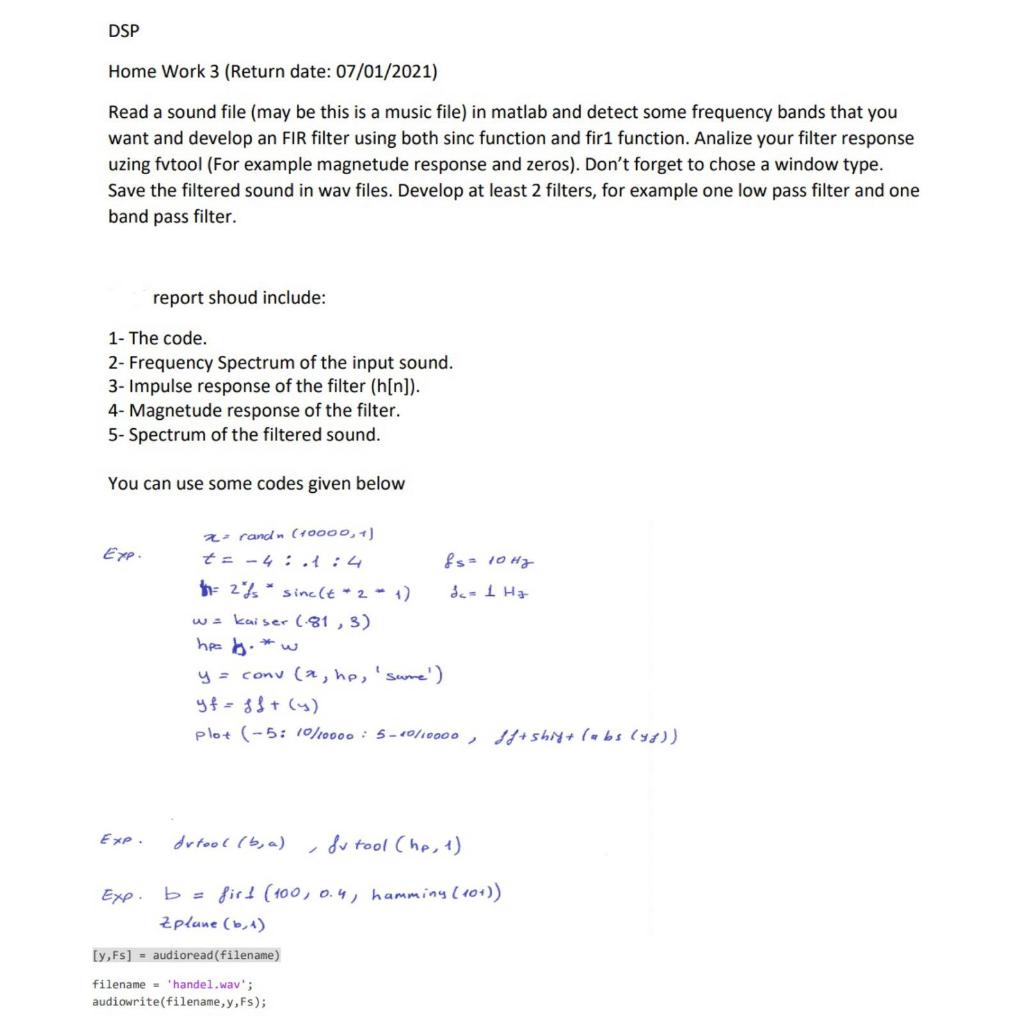
DSP Home Work 3 (Return date: 07/01/2021) Read a sound file (may be this is a music file) in matlab and detect some frequency bands that you want and develop an FIR filter using both sinc function and fir1 function. Analize your filter response uzing fvtool (For example magnetude response and zeros). Don't forget to chose a window type. Save the filtered sound in wav files. Develop at least 2 filters, for example one low pass filter and one band pass filter. report shoud include: 1- The code. 2- Frequency Spectrum of the input sound. 3- Impulse response of the filter (h[n]). 4- Magnetude response of the filter. 5- Spectrum of the filtered sound. You can use some codes given below Exp. 2 rand (+0000, +) to-4:.:4 & s= 10Hg the 235 * sinc(t - 2 - 1) da 1 Ha wa Kaiser (-81, 3) ha b. w y = conu (a, hp, 'same') yf=sS+ (4) plot (-5: 10/10000 : 5-10/10000 , 18+ sh 4+ (Hbs ()) dutool (b, a) Sv tool (he, 1) Exp b = firt (100) 0.4, hamming (10+)) Zplune (6,4) [y,Fs] = audioread(filename) filename = 'handel.wav"; audiowrite(filename, y,Fs)
Step by Step Solution
There are 3 Steps involved in it

Get step-by-step solutions from verified subject matter experts