

Question: ` ` ` dt = pandas.read _ csv ( ' . / co - est 2 0 1 9 - alldata.csv ' , encoding =
dt pandas.readcsvcoestalldata.csv encoding'latn
data dftodictrecords
dbpopulations.drop
dbpopulations.insertmanydata
printDone
Done!
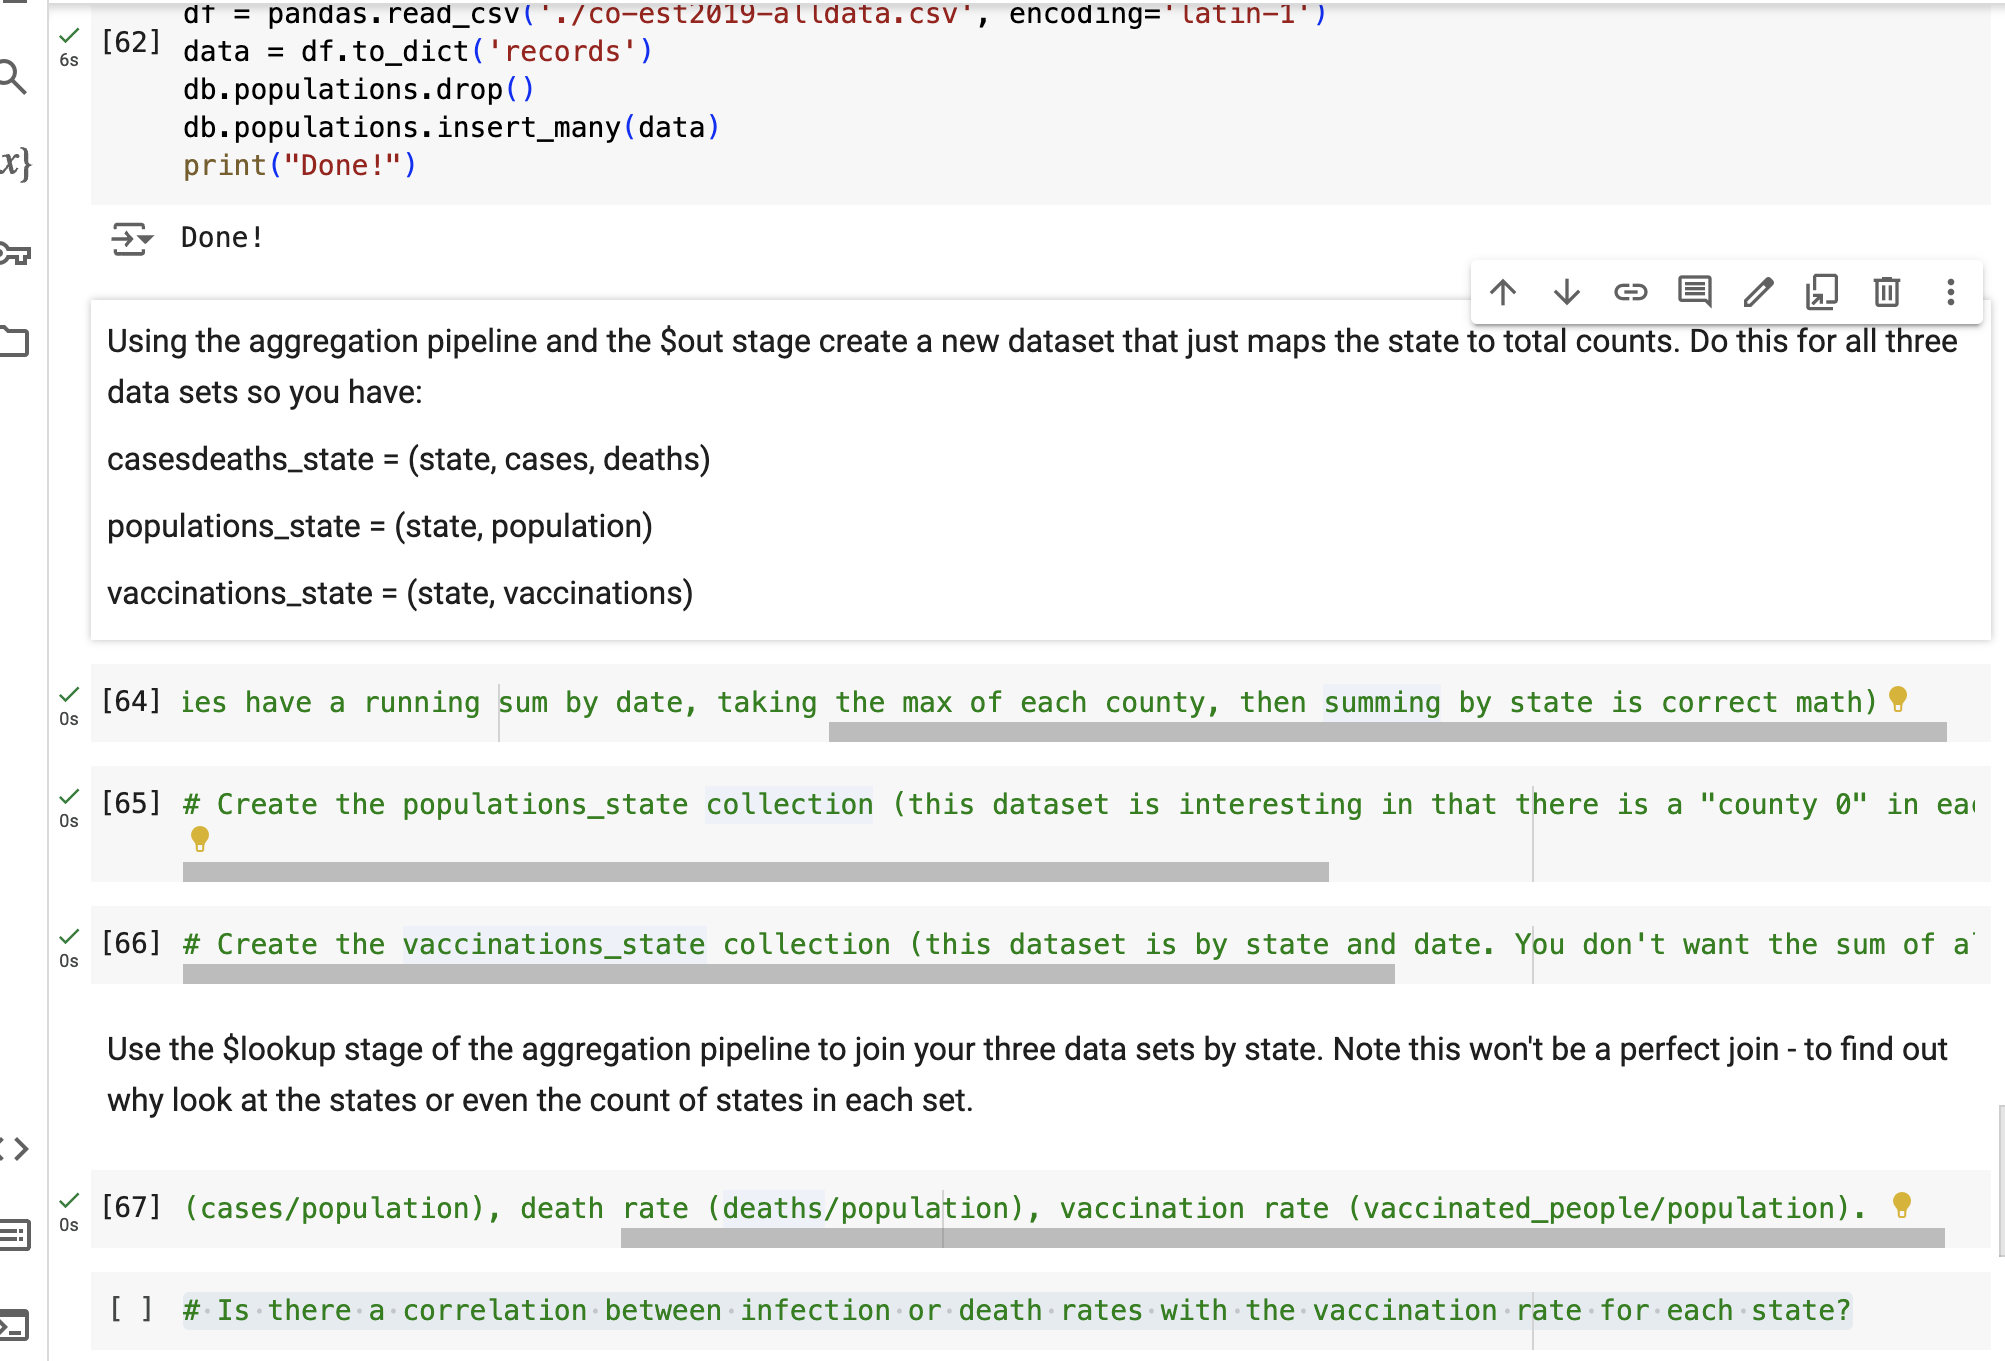
Using the aggregation pipeline and the $out stage create a new dataset that just maps the state to total counts. Do this for all three data sets so you have:
casesdeathsstate state cases, deaths
populationsstate state, population
vaccinationsstate state, vaccinations
s ies have a running sum by date, taking the max of each county, then summing by state is correct math
# Create the vaccinationsstate collection this dataset is by state and date. You don't want the sum of a
Use the $lookup stage of the aggregation pipeline to join your three data sets by state. Note this won't be a perfect join to find out why look at the states or even the count of states in each set.
os casespopulation death rate deathspopulation vaccination rate vaccinatedpeoplepopulation
# Is there a correlation between infection or death rates with the vaccination rate for each state?
Step by Step Solution
There are 3 Steps involved in it
1 Expert Approved Answer
Step: 1 Unlock

Question Has Been Solved by an Expert!
Get step-by-step solutions from verified subject matter experts
Step: 2 Unlock
Step: 3 Unlock