

Question: DTFT Convolution property (with detailed explanation) = = = clf; W = linspace (-pi, pi, 256); x1 [1 3 5 7 9 11 13 15
DTFT Convolution property (with detailed explanation)
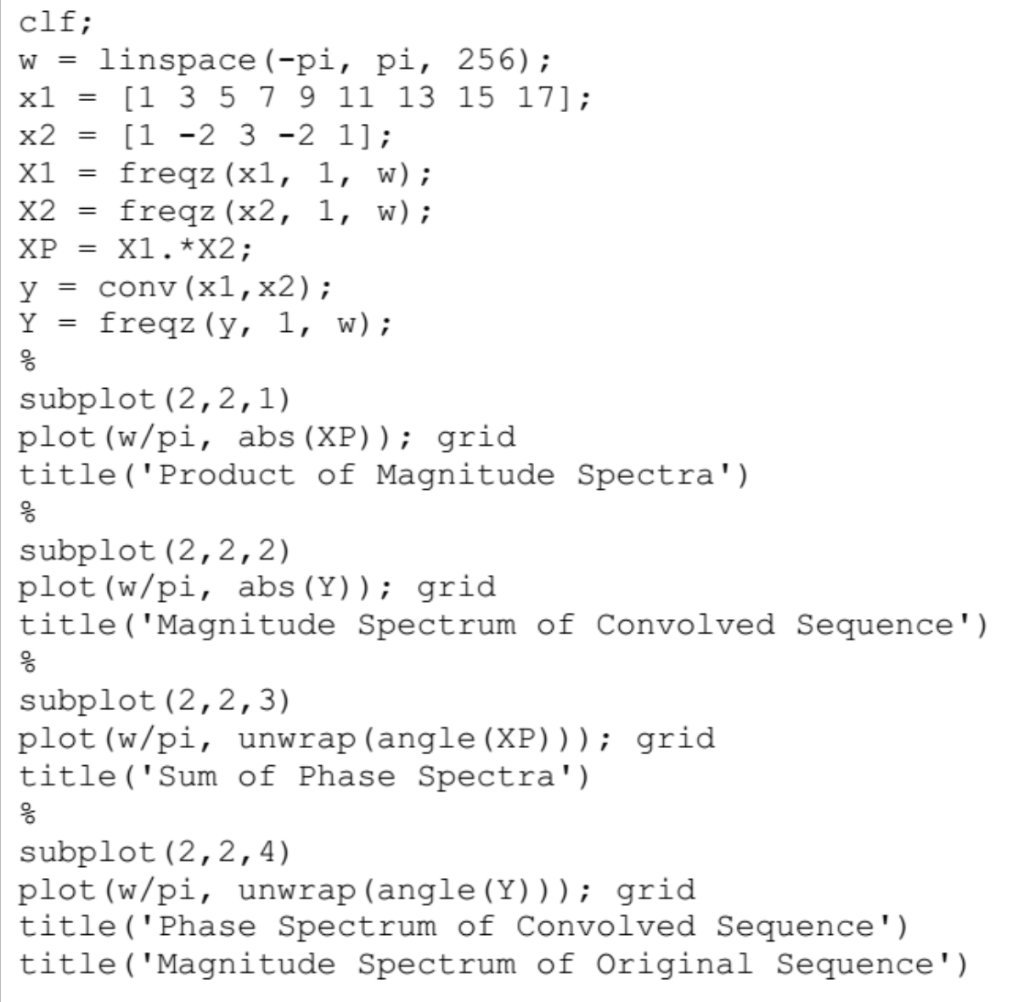
= = = clf; W = linspace (-pi, pi, 256); x1 [1 3 5 7 9 11 13 15 17]; x2 [1 -2 3-2 1]; x1 freqz (x1, 1, w); X2 freqz (x2, 1, w); XP x1.*X2; y = conv (x1,x2); Y = freqz (y, 1, w); subplot (2,2,1) plot (w/pi, abs (XP)); grid title('Product of Magnitude Spectra') subplot (2,2,2) plot (w/pi, abs (Y)); grid title ('Magnitude Spectrum of Convolved Sequence') subplot (2,2,3) plot (w/pi, unwrap (angle (XP))); grid title ('Sum of Phase Spectra') of subplot (2,2,4) plot (w/pi, unwrap (angle (Y))); grid title ('Phase Spectrum of Convolved Sequence') title ('Magnitude Spectrum of Original Sequence') b) Challenge: The phase of both signals look quite smooth, except for a couple of small jags. You may have noticed similar small jags in the phase spectra of other signals. These are artifacts, meaning they shouldn't be there, and are caused by some inaccuracy in the way Matlab calculates those particular values. What causes them? Why are they difficult to overcome? Hint: take a look at the magnitude spectrum
Step by Step Solution
There are 3 Steps involved in it

Get step-by-step solutions from verified subject matter experts