

Question: Due to a recent change by Microsoft you will need to open the XLMiner Analysis ToolPak add-in manually from the home ribbon. Screenshot of ToolPak
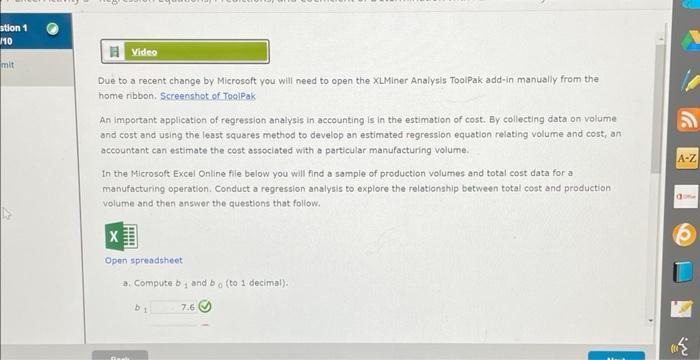
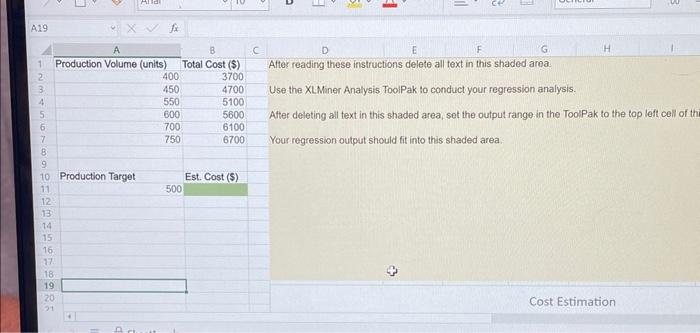
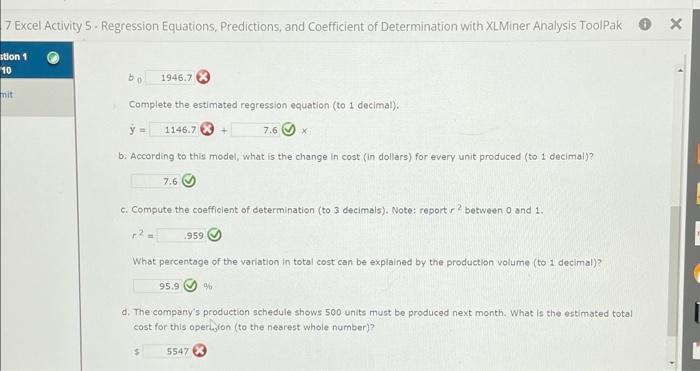
Due to a recent change by Microsoft you will need to open the XLMiner Analysis ToolPak add-in manually from the home ribbon. Screenshot of ToolPak An important application of regression analysis in accounting is in the estimation of cost. By collecting data on volume and cost and using the least squares method to develop an estimated regression equation relating volume and cost, an accountant can estimate the cost associated with a particular manufacturing volume. In the Microsoft Excel Online file below you will find a sample of production volumes and total cost data for a manufacturing operation. Conduct a regression analysis to explore the relationship between total cost and production volume and then answer the questions that follow. Open spreadsheet a. Compute b1 and b0 (to 1 decimal). After reading these instructions delete all text in this shaded area. Use the XLMiner Analysis ToolPak to conduct your regression analysis. After deleting ail text in this shaded area, set the output range:in the ToolPak to the top left cell of th Your regression output should fit into this shaded area. Due to a recent change by Microsoft you will need to open the XLMiner Analysis ToolPak add-in manually from the home ribbon. Screenshot of ToolPak An important application of regression analysis in accounting is in the estimation of cost. By collecting data on volume and cost and using the least squares method to develop an estimated regression equation relating volume and cost, an accountant can estimate the cost associated with a particular manufacturing volume. In the Microsoft Excel Online file below you will find a sample of production volumes and total cost data for a manufacturing operation. Conduct a regression analysis to explore the relationship between total cost and production volume and then answer the questions that follow. Open spreadsheet a. Compute b1 and b0 (to 1 decimal). After reading these instructions delete all text in this shaded area. Use the XLMiner Analysis ToolPak to conduct your regression analysis. After deleting ail text in this shaded area, set the output range:in the ToolPak to the top left cell of th Your regression output should fit into this shaded area
Step by Step Solution
There are 3 Steps involved in it

Get step-by-step solutions from verified subject matter experts