Question: Due to a recent change by Microsoft you will need to open the XLMiner Analysis ToolPak add-in manually from the home ribbon. Screenshot of ToolPak
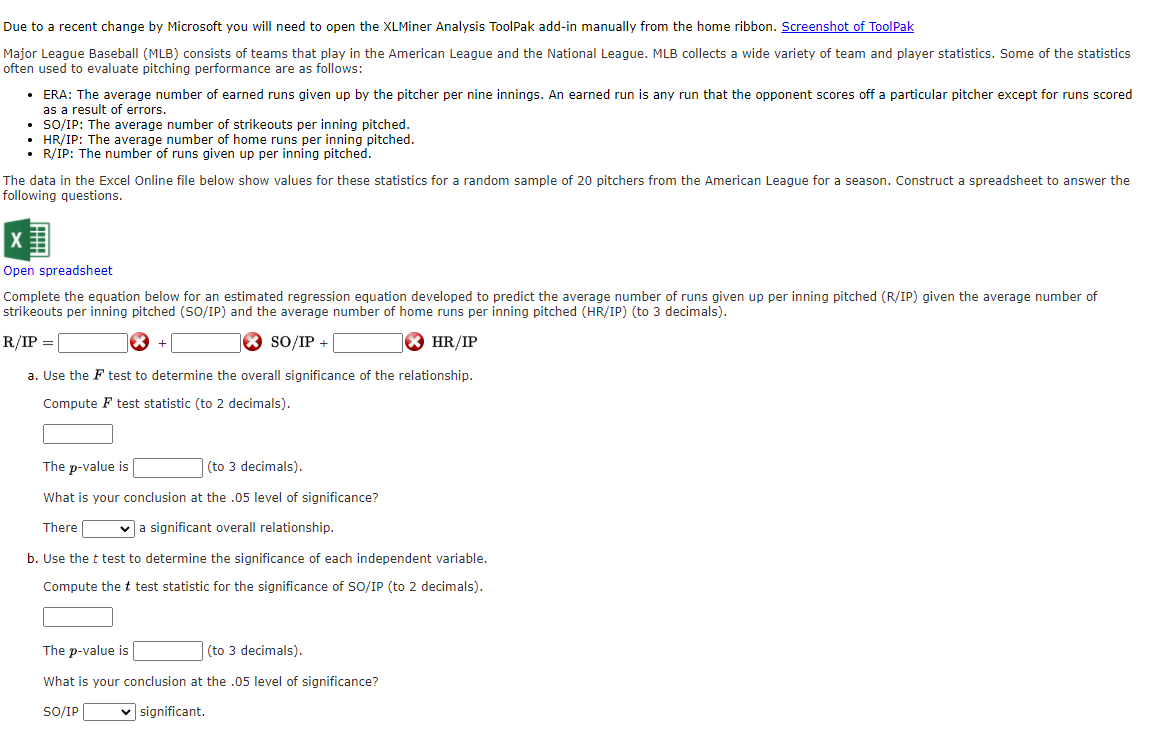
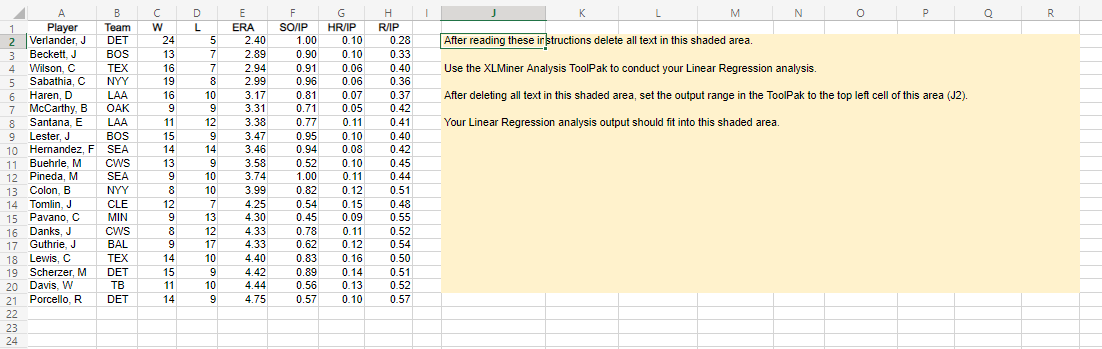
Due to a recent change by Microsoft you will need to open the XLMiner Analysis ToolPak add-in manually from the home ribbon. Screenshot of ToolPak Major League Baseball (MLB) consists of teams that play in the American League and the National League. MLB collects a wide variety of team and player statistics. Some of the statistics often used to evaluate pitching performance are as follows: ERA: The average number of earned runs given up by the pitcher per nine innings. An earned run is any run that the opponent scores off a particular pitcher except for runs scored as a result of errors. SO/IP: The average number of strikeouts per inning pitched. HR/IP: The average number of home runs per inning pitched. R/IP: The number of runs given up per inning pitched. The data in the Excel Online file below show values for these statistics for a random sample of 20 pitchers from the American League for a season. Construct a spreadsheet to answer the following questions. Open spreadsheet Complete the equation below for an estimated regression equation developed to predict the average number of runs given up per inning pitched (R/IP) given the average number of strikeouts per inning pitched (SO/IP) and the average number of home runs per inning pitched (HR/IP) (to 3 decimals). R/IP = X + X SO/IP + X HR/IP a. Use the F test to determine the overall significance of the relationship. Compute F test statistic (to 2 decimals). The p-value is (to 3 decimals). What is your conclusion at the .05 level of significance? There a significant overall relationship. b. Use the t test to determine the significance of each independent variable. Compute the t test statistic for the significance of SO/IP (to 2 decimals). The p-value is (to 3 decimals). What is your conclusion at the .05 level of significance? SO/IP significant 1 J K M N Q R D L After reading these instructions delete all text in this shaded area. 5 7 7 Use the XLMiner Analysis ToolPak to conduct your Linear Regression analysis. 10 After deleting all text in this shaded area, set the output range in the ToolPak to the top left cell of this area (J2). 12 Your Linear Regression analysis output should fit into this shaded area. 14 A 1 Player Verlander, J Beckett, J Wilson, C Sabathia, C Haren, D 7 McCarthy, B Santana, E Lester, J 10 Hernandez, F Buehrle M 12 Pineda, M 13 Colon, B 14 Tomlin, J 15 Pavano, C 16 Danks, J Guthrie, J 18 Lewis, C 19 Scherzer, M 20 Davis. W 21 Porcello R , nmin OPERENA B Team DET BOS TEX NYY LAA OAK LAA BOS SEA CWS SEA NYY CLE MIN CWS BAL TEX DET TB DET C w 24 13 16 19 16 9 11 15 14 13 9 8 12 9 9 8 9 14 15 11 14 8ps2949e97BQHmwm9 E ERA 2.40 2.89 2.94 2.99 3.17 3.31 3.38 3.47 3.46 3.58 3.74 3.99 4.25 4.30 4.33 4.33 4.40 4.42 4.44 4.75 F SO/IP 1.00 0.90 0.91 0.96 0.81 0.71 0.77 0.95 0.94 0.52 1.00 0.82 0.54 0.45 0.78 0.62 0.83 0.89 0.56 0.57 HR/IP 0.10 0.10 0.06 0.06 0.07 0.05 0.11 0.10 0.08 0.10 0.11 0.12 0.15 0.09 0.11 0.12 0.16 0.14 0.13 0.10 H R/IP 0.28 0.33 0.40 0.36 0.37 0.42 0.41 0.40 0.42 0.45 0.44 0.51 0.48 0.55 0.52 0.54 0.50 0.51 0.52 0.57 10 10 13 12 17 10 10 24


