

Question: Due to a recent change by Microsoft you will need to open the XLMiner Analysis ToolPak add-in manually from the home ribbon. Screenshot of ToolPak
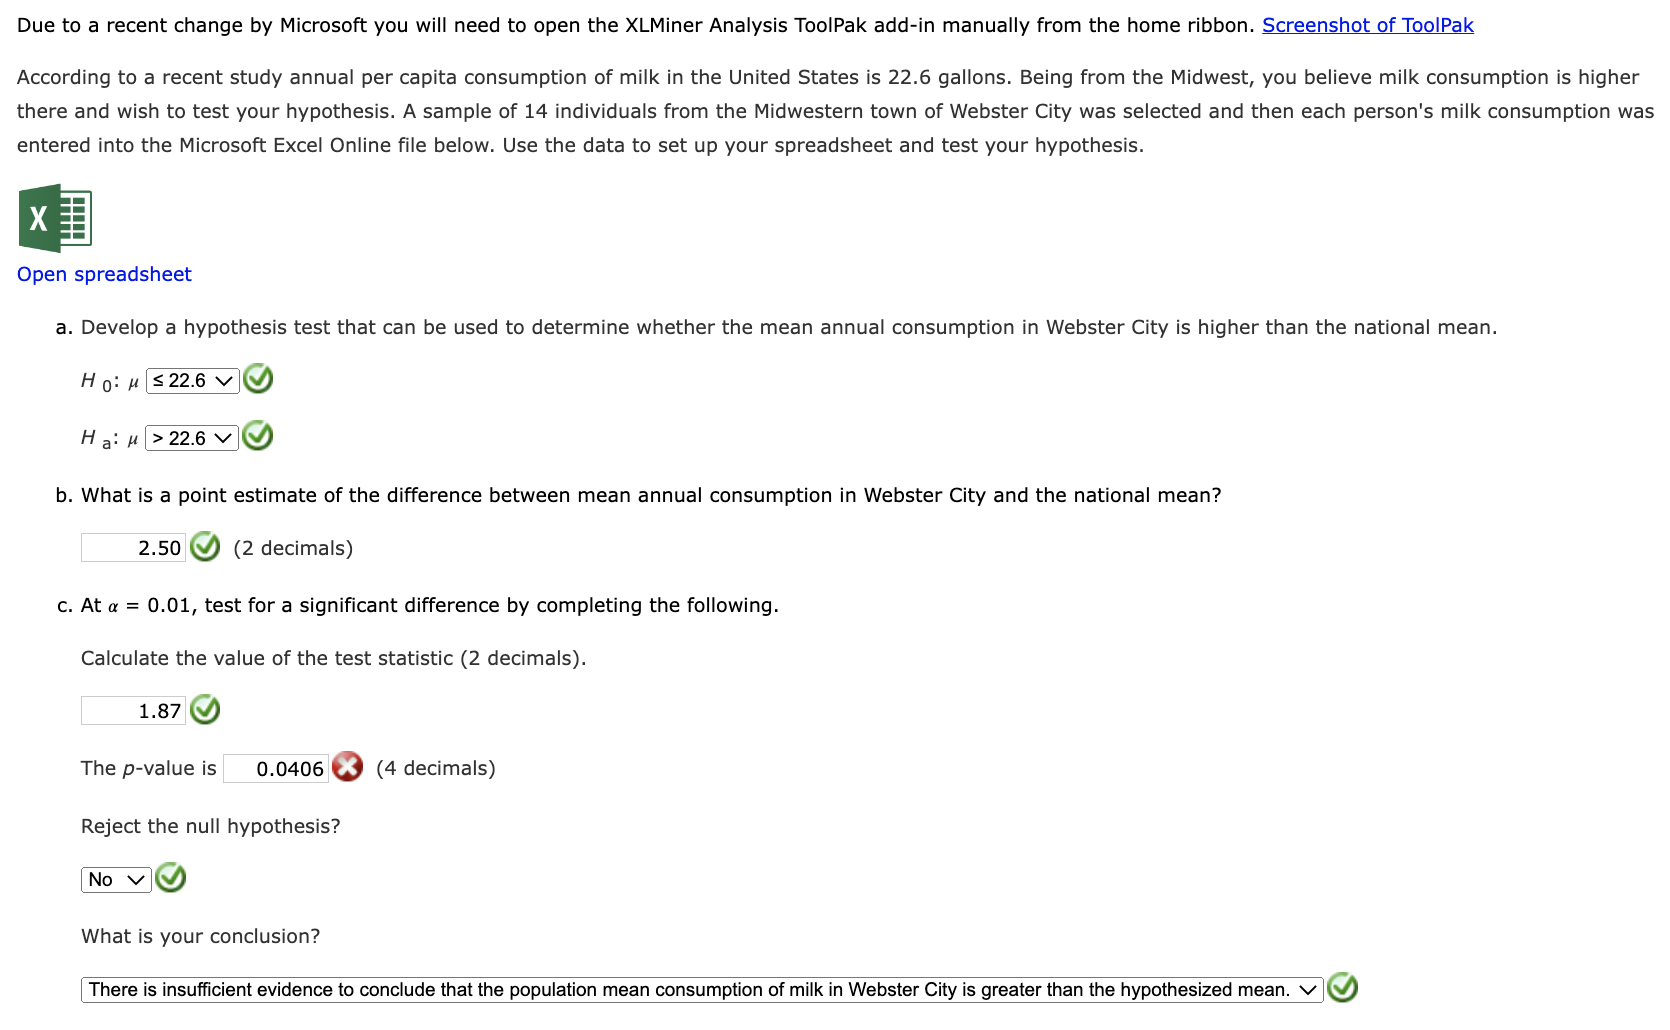
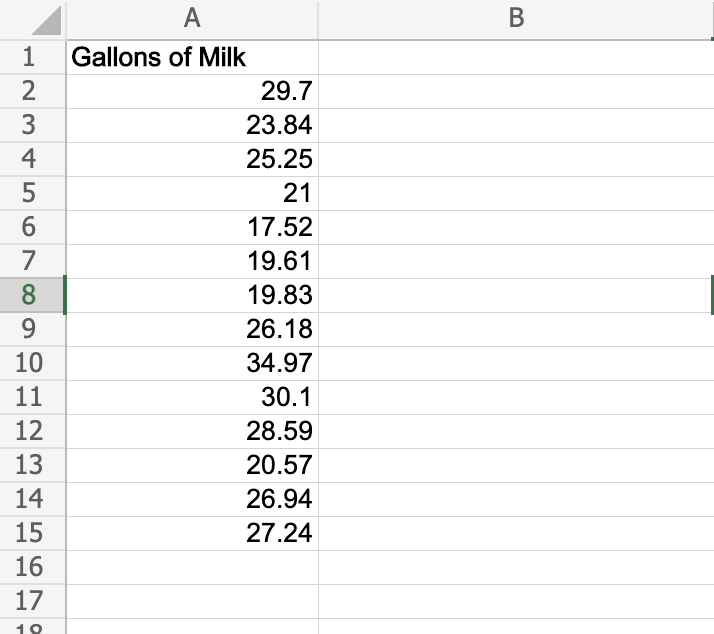
Due to a recent change by Microsoft you will need to open the XLMiner Analysis ToolPak add-in manually from the home ribbon. Screenshot of ToolPak According to a recent study annual per capita consumption of milk in the United States is 22.6 gallons. Being from the Midwest, you believe milk consumption is higher there and wish to test your hypothesis. A sample of 14 individuals from the Midwestern town of Webster City was selected and then each person's milk consumption was entered into the Microsoft Excel Online file below. Use the data to set up your spreadsheet and test your hypothesis. Open spreadsheet a. Develop a hypothesis test that can be used to determine whether the mean annual consumption in Webster City is higher than the national mean. H 01 H _Q9 H y -@ b. What is a point estimate of the difference between mean annual consumption in Webster City and the national mean? 2.50 Q0 (2 decimals) c. At a = 0.01, test for a signicant difference by completing the following. Calculate the value of the test statistic (2 decimals). 1.87 M The p-value is 0.0406 0 (4 decimals) Reject the null hypothesis? -\\:0 What is your conclusion? | There is insufcient evidence to conclude that the population mean consumption of milk in Webster City is greater than the hypothesized mean. v lw
Step by Step Solution
There are 3 Steps involved in it

Get step-by-step solutions from verified subject matter experts