

Question: During September of the current year, the controller was asked to perform variance analyses for August. The January operating data provided the standard prices, rates,
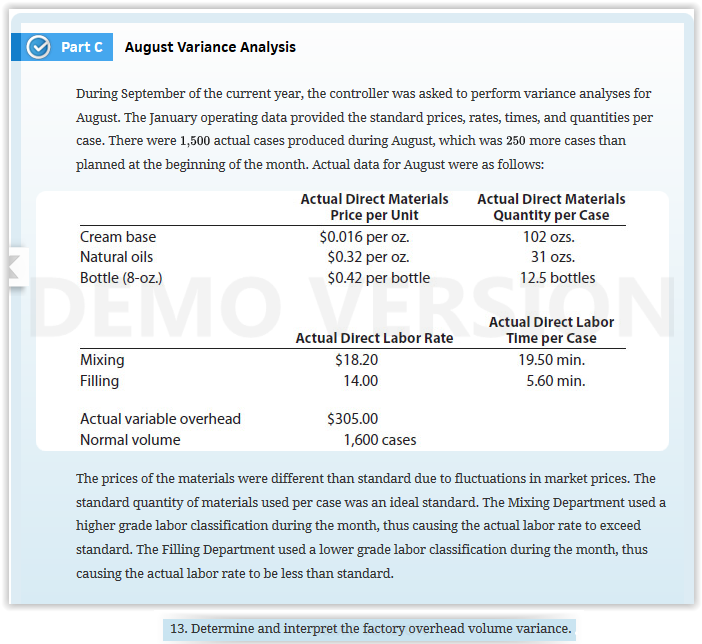
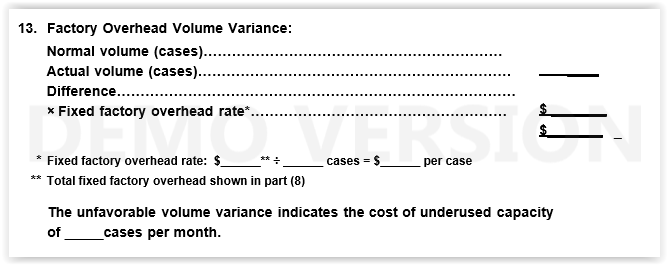
During September of the current year, the controller was asked to perform variance analyses for August. The January operating data provided the standard prices, rates, times, and quantities per case. There were 1,500 actual cases produced during August, which was 250 more cases than planned at the beginning of the month. Actual data for August were as follows: The prices of the materials were different than standard due to fluctuations in market prices. The standard quantity of materials used per case was an ideal standard. The Mixing Department used a higher grade labor classification during the month, thus causing the actual labor rate to exceed standard. The Filling Department used a lower grade labor classification during the month, thus causing the actual labor rate to be less than standard. Determine and interpret the factory overhead volume variance During September of the current year, the controller was asked to perform variance analyses for August. The January operating data provided the standard prices, rates, times, and quantities per case. There were 1,500 actual cases produced during August, which was 250 more cases than planned at the beginning of the month. Actual data for August were as follows: The prices of the materials were different than standard due to fluctuations in market prices. The standard quantity of materials used per case was an ideal standard. The Mixing Department used a higher grade labor classification during the month, thus causing the actual labor rate to exceed standard. The Filling Department used a lower grade labor classification during the month, thus causing the actual labor rate to be less than standard. Determine and interpret the factory overhead volume variance
Step by Step Solution
There are 3 Steps involved in it

Get step-by-step solutions from verified subject matter experts