

Question: During the pandemic, an insurance company surveyed the distances (in kilome- tres) driven by a random sample of its customers in February and then
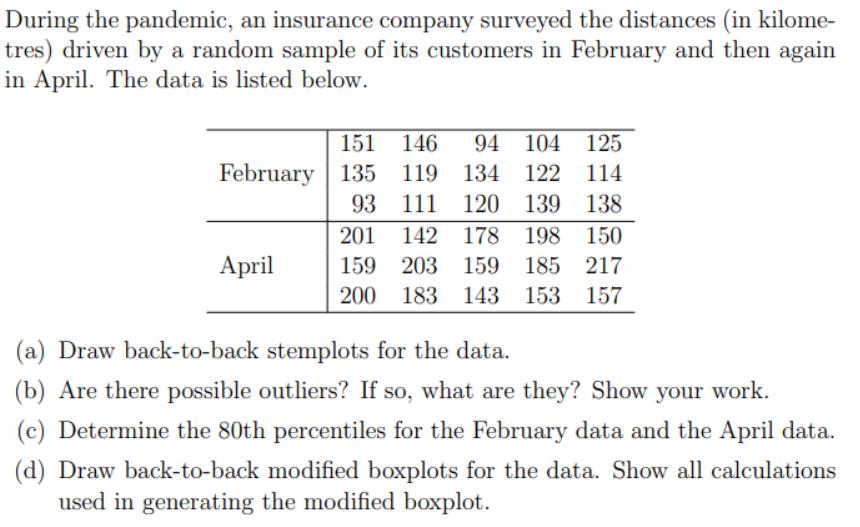
During the pandemic, an insurance company surveyed the distances (in kilome- tres) driven by a random sample of its customers in February and then again in April. The data is listed below. 151 146 94 104 125 February 135 119 134 122 114 93 111 120 139 138 April 150 201 142 178 198 159 203 159 185 217 200 183 143 153 157 (a) Draw back-to-back stemplots for the data. (b) Are there possible outliers? If so, what are they? Show your work. (c) Determine the 80th percentiles for the February data and the April data. (d) Draw back-to-back modified boxplots for the data. Show all calculations used in generating the modified boxplot.
Step by Step Solution
3.28 Rating (148 Votes )
There are 3 Steps involved in it
Data in Ascending order Q1 Febmary 9394 104 111 114 119 120 122 median April 125 138 135 138 14... View full answer

Get step-by-step solutions from verified subject matter experts