

Question: D(x,t=0.02 5) Shown on the right is a snapshot graph of a wave pulse on a string. The pulse is 100 '8 - moving to
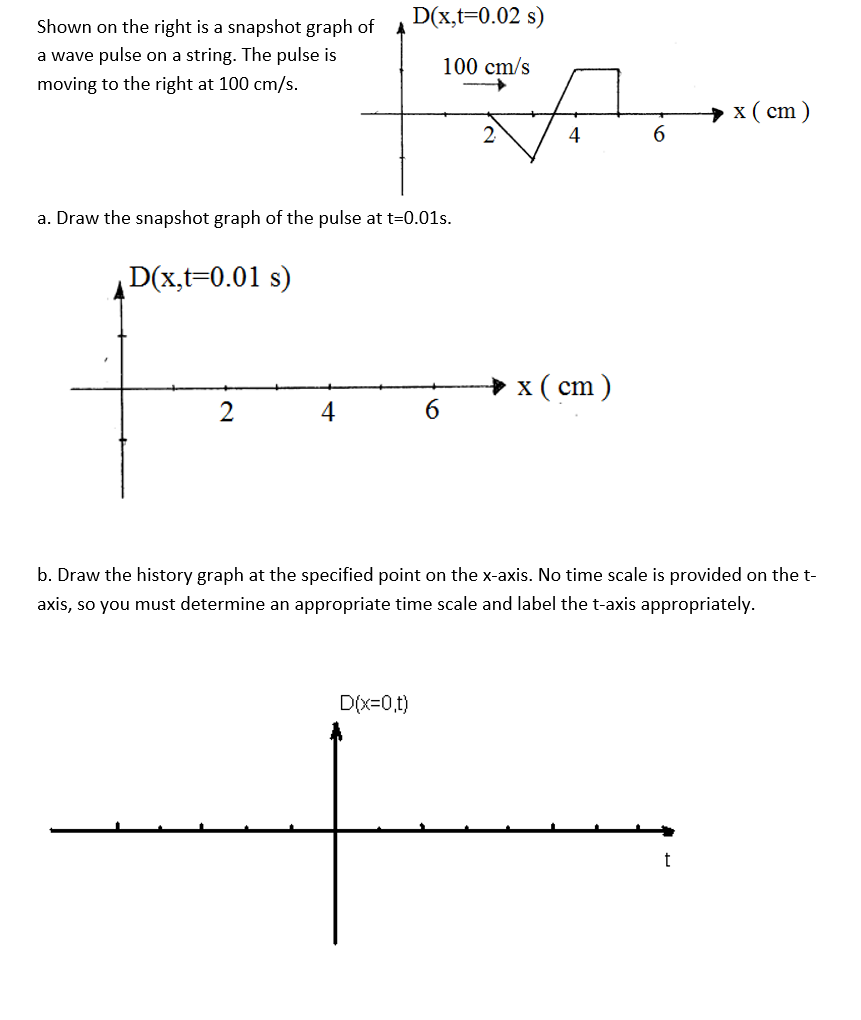
D(x,t=0.02 5) Shown on the right is a snapshot graph of a wave pulse on a string. The pulse is 100 '8 - moving to the right at 100 cmis. x ( cm) 3. Draw the snapshot graph of the pulse at t=0.{]1s. D(x,t=0.01 s) x(cm) b. Draw the history graph at the specified point on the xaxis. No time scale is provided on the t axis, so you must determine an appropriate time scale and label the taxis appropriately. openly
Step by Step Solution
There are 3 Steps involved in it
1 Expert Approved Answer
Step: 1 Unlock

Question Has Been Solved by an Expert!
Get step-by-step solutions from verified subject matter experts
Step: 2 Unlock
Step: 3 Unlock