

Question: E 1 Delete this text then place your Simple Regression output in this shaded area. Output range $ E $ 1 Delete this text then
E
Delete this text then place your Simple Regression output in this shaded area. Output range $$
Delete this text then place your Multiple Regression output in this shaded area. Output range $ E
Workbook Statistics
Activity Multiple Regression Equations and Predictions with XLMiner Analysis ToolPak
Yideo
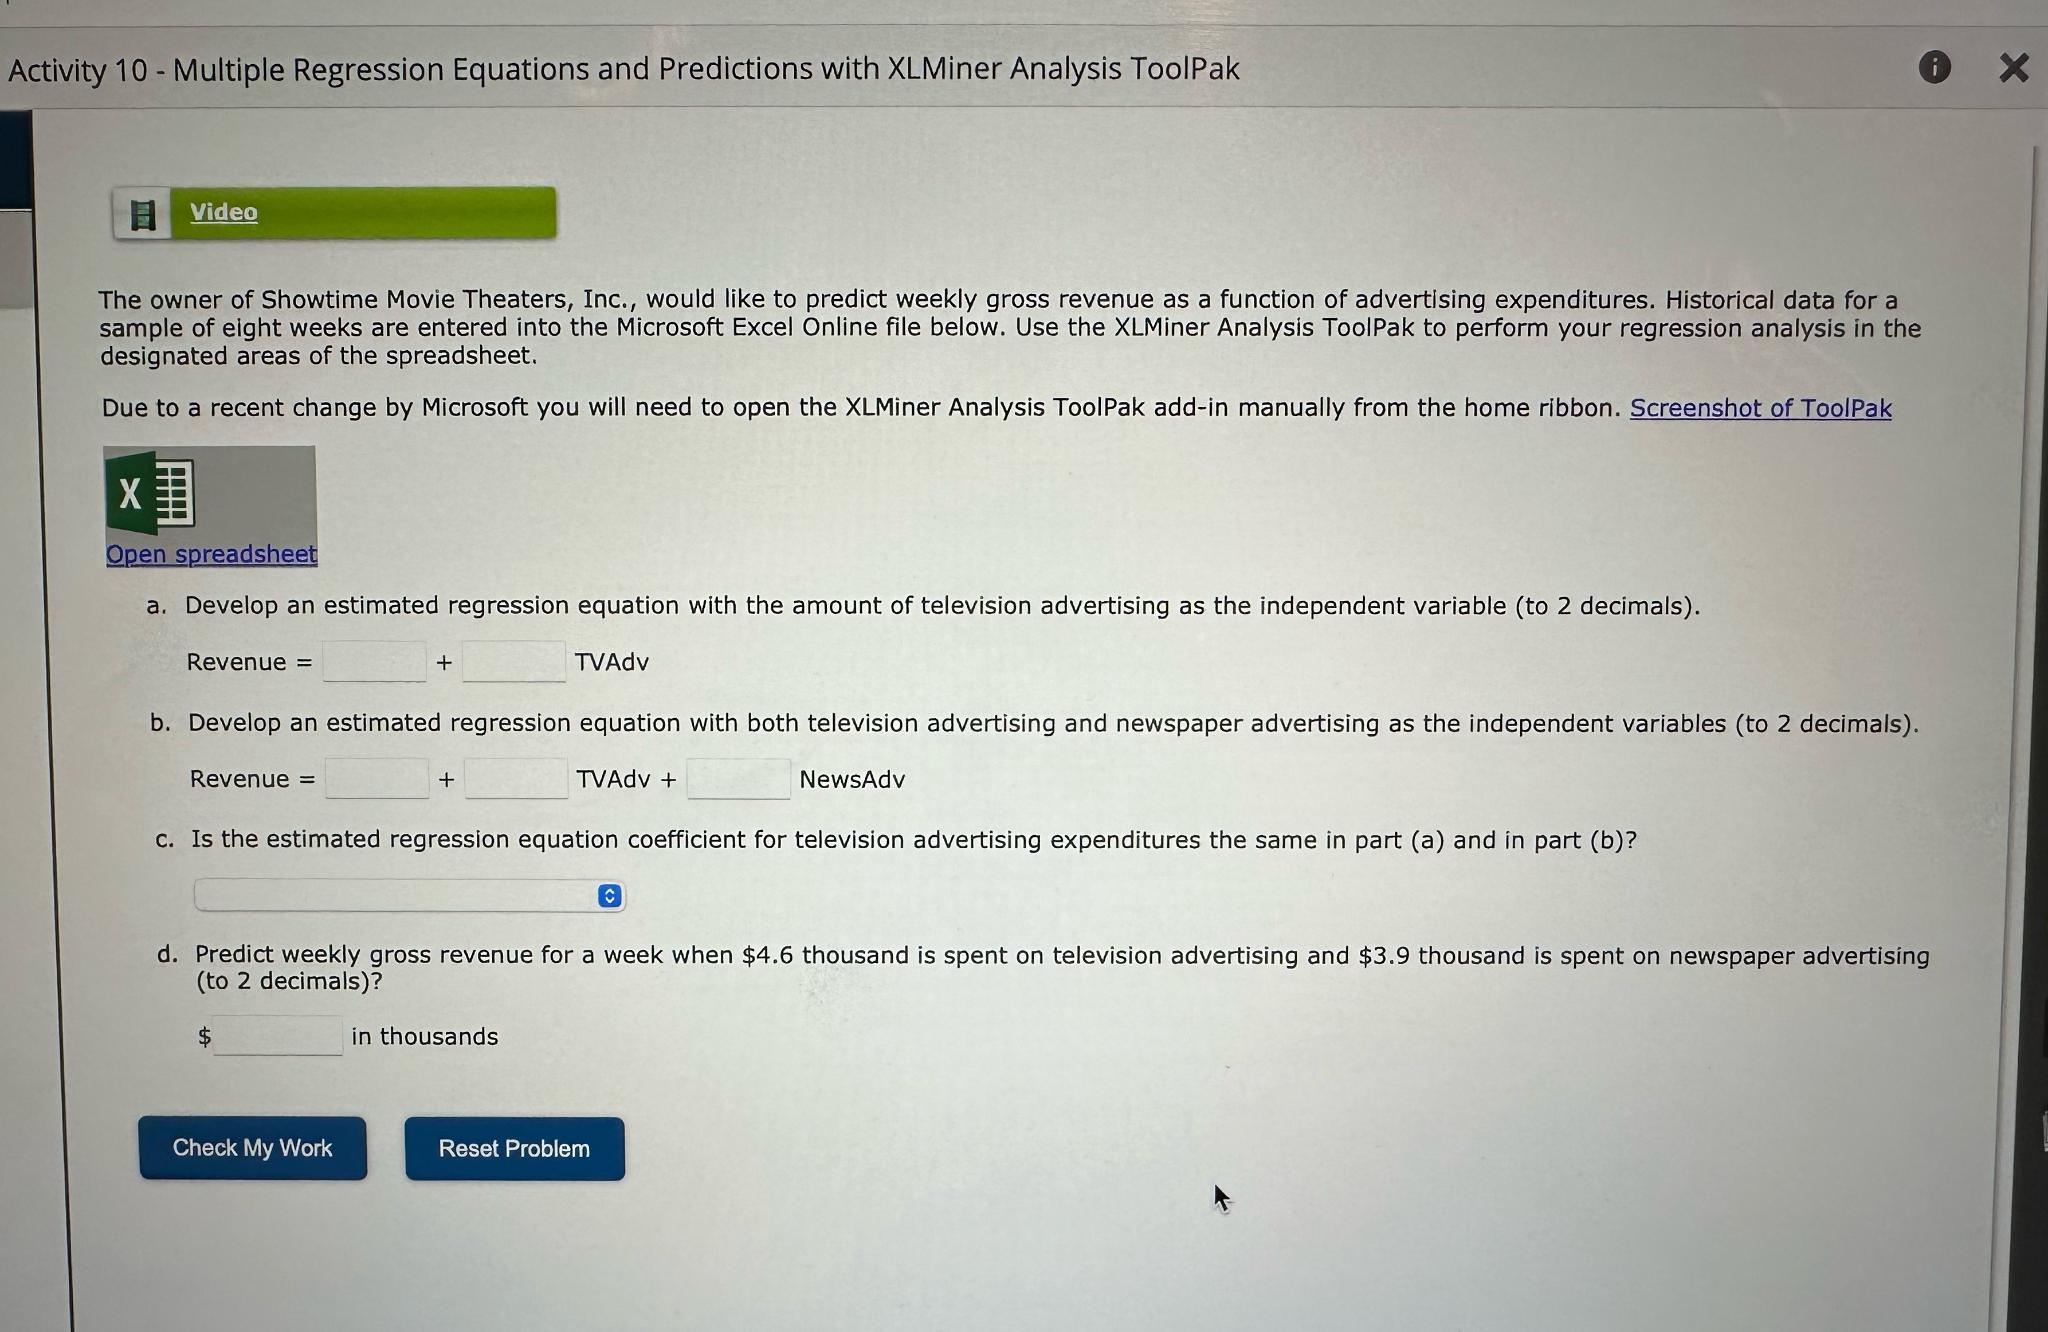
The owner of Showtime Movie Theaters, Inc., would like to predict weekly gross revenue as a function of advertising expenditures. Historical data for a sample of eight weeks are entered into the Microsoft Excel Online file below. Use the XLMiner Analysis ToolPak to perform your regression analysis in the designated areas of the spreadsheet.
Due to a recent change by Microsoft you will need to open the XLMiner Analysis ToolPak addin manually from the home ribbon. Screenshot of ToolPak
a Develop an estimated regression equation with the amount of television advertising as the independent variable to decimals
Revenue TVAdv
b Develop an estimated regression equation with both television advertising and newspaper advertising as the independent variables to decimals
Revenue TVAdv NewsAdv
c Is the estimated regression equation coefficient for television advertising expenditures the same in part a and in part b
d Predict weekly gross revenue for a week when $ thousand is spent on television advertising and $ thousand is spent on newspaper advertising to decimals
in thousands
Step by Step Solution
There are 3 Steps involved in it
1 Expert Approved Answer
Step: 1 Unlock

Question Has Been Solved by an Expert!
Get step-by-step solutions from verified subject matter experts
Step: 2 Unlock
Step: 3 Unlock