

Question: e 3 : The initial footing design for the structures shown in Fig. 1 . Figure 4 : General geometric parameters of a culvert (
e : The initial footing design for the structures shown in Fig. Figure : General geometric parameters of a culvert AS Fig. CL
b Side
Figure : External dimensions of the culvert and its top and side views. Note that only half of
the culvert is shown in the side view a due to symmetry.Culvert loading
This section of the project can be completed independently from the other tasks listed above.
In this task, you have to calculate the design loads to be applied on the culvert shown in Fig.
based on AS This may require you to also consult with AS
You only need to calculate the ultimate design loads relevant to strength limit state. You
need to calculate the design loads on top of the culvert and its sides. The embankment and the
culvert are both symmetric so loading of one side is enough.
You would need to calculate the dead loads and traffic loads on the culvert. For dead loads,
you only need to consider earth pressure due to fill and compaction AS
For traffic loads, you only need to consider W
For calculation of traffic loads, you should use the simplified truncated prism method as
explained in AS For traffic load on top of the culvert, you need to show the
details of the calculation. However, for the traffic load on sides, it is enough to present the final
results in form of a table or graph as appropriate. For an example and perhaps also verification
see AS Table G
To increase your mark, you can compare the abovementioned traffic loads on top of the
culvert with the stresses calculated using Boussinesq solution as explained in Ghabraie
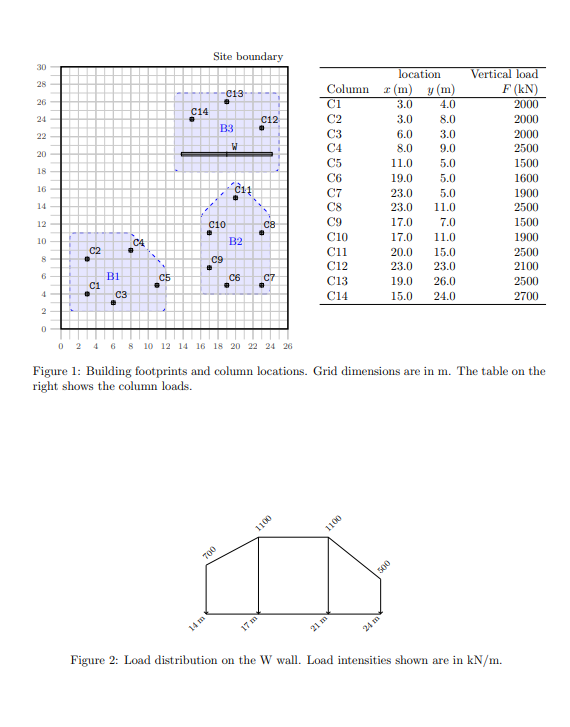
Chapter or using the precise analysis explained in ASG For more information, refer to the rubric for this assessment item.Figure : Building footprints and column locations. Grid dimensions are in The table on the
right shows the column loads.
Figure : Load distribution on the wall. Load intensities shown are in
Step by Step Solution
There are 3 Steps involved in it
1 Expert Approved Answer
Step: 1 Unlock

Question Has Been Solved by an Expert!
Get step-by-step solutions from verified subject matter experts
Step: 2 Unlock
Step: 3 Unlock