

Question: (e) Also, discuss why AU changed by looking at fixed asset utilization, days inventory, and days accounts receivables trends , and why the NPM changed
(e) Also, discuss why AU changed by looking at fixed asset utilization, days inventory, and days accounts receivables trends, and why the NPM changed by looking at GPM, OPM over time and comparisons to the industry averages.
(f) Calculate the Zeta Score for the current year for the company (see pages 228 to 229 of the text in Chapter 9) and the Review for Ex2 example. What does this reveal about the companys solvency risk, where.
Z = 1.2 WC + 1.4 RE + 3.3 OROA + 0.6 Equity + 0.999 AT
where WC = Working capital to total assets, where working capital = total current assets total current liabilities
RE = Retained earnings to total assets.
OROA = Earnings before interest & taxes to Assets
Equity = Value of Equity to Debt
AT = Asset Turnover = Revenues to Total Assets
(g) Summarize the strengths and weaknesses for the company based on your above analysis including what you found for the entire analysis including your analysis of liquidity, solvency, and financial performance.
(h) If the company expects its cash flow from operations to be equal to
the previous year, should the $200,000 seasonal loan be made? Explain why or why not. As a seasonal one-year loan, what would be the typical collateral for the loan?
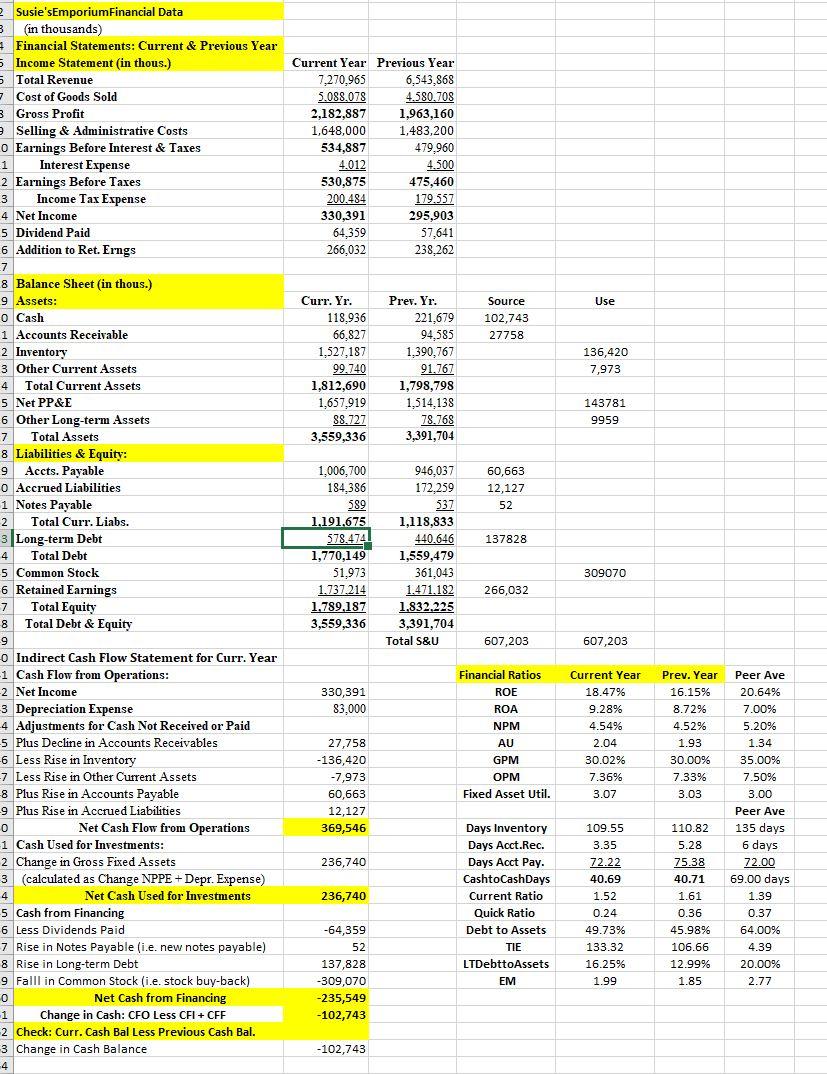
Current Year Previous Year 7,270,965 6,543,868 5.088,078 4.580.708 2,182,887 1,963,160 1,648,000 1,483,200 534,887 479,960 4.012 4.500 530,875 475,460 200.484 179.557 330,391 295,903 64,359 57,641 266,032 238,262 Use Source 102,743 27758 Curr. Yr. 118,936 66,827 1,527,187 99,740 1,812,690 1,657,919 88.727 3,559,336 Prev. Yr. 221,679 94,585 1.390,767 91.767 1,798,798 1,514,138 78.768 3,391,704 136,420 7,973 143781 9959 60,663 12,127 52 ? Susie'sEmporiumFinancial Data 3 (in thousands) # Financial Statements: Current & Previous Year 5 Income Statement in thous.) Total Revenue Cost of Goods Sold 8 Gross Profit Selling & Administrative Costs o Earnings Before Interest & Taxes 1 Interest Expense 2 Earnings Before Taxes 3 Income Tax Expense 4 Net Income 5 Dividend Paid 6 Addition to Ret. Erngs 7 8 Balance Sheet (in thous.) 9 Assets: o Cash 1 Accounts Receivable 2 Inventory 3 Other Current Assets 4 Total Current Assets 5 Net PP&E 6 Other Long-term Assets 7 Total Assets 8 Liabilities & Equity: 9 Accts. Payable o Accrued Liabilities 1 Notes Payable 2 Total Curr. Liabs. 3 Long-term Debt 4 Total Debt 5 Common Stock 6 Retained Earnings 7 Total Equity 8 Total Debt & Equity 9 o Indirect Cash Flow Statement for Curr. Year -1 Cash Flow from Operations: 2 Net Income -3 Depreciation Expense 4 Adjustments for Cash Not Received or Paid 5 Plus Decline in Accounts Receivables -6 Less Rise in Inventory 7 Less Rise in Other Current Assets 8 Plus Rise in Accounts Payable -9 Plus Rise in Accrued Liabilities 0 Net Cash Flow from Operations 1 Cash Used for Investments: 2 Change in Gross Fixed Assets 3 (calculated as Change NPPE + Depr. Expense) 4 Net Cash Used for Investments 5 Cash from Financing 6 Less Dividends Paid 7 Rise in Notes Payable (i.e. new notes payable) 8 Rise in Long-term Debt 9 Faill in Common Stock (i.e. stock buy-back) 0 Net Cash from Financing -1 Change in Cash: CFO Less CFI + CFF 2 Check: Curr. Cash Bal Less Previous Cash Bal. 3 Change in Cash Balance -4 4 578.4741 137828 1,006,700 184 386 589 1,191,675 18.45 1,770,149 51,973 1.737.214 1,789.187 3,559,336 946,037 172,259 537 1,118,833 440.646 1,559,479 361,043 1.471.182 1.832.225 3,391,704 Total S&U 309070 266,032 607,203 607,203 330,391 83.000 Financial Ratios ROE ROA NPM AU GPM OPM Fixed Asset Util. Current Year 18.47% 9.28% 4.54% 2.04 30.02% 7.36% 3.07 Prev. Year 16.15% 8.72% 4.52% 1.93 30.00% 7.33% 3.03 27,758 -136,420 -7,973 60,663 12,127 369,546 Peer Ave 20.64% 7.00% 5.20% 1.34 35.00% 7.50% 3.00 Peer Ave 135 days 6 days 236,740 236,740 Days Inventory Days Acct.Rec. Days Acct Pay. CashtoCashDays Current Ratio Quick Ratio Debt to Assets TIE LTDebttoAssets 109.55 3.35 72.22 40.69 1.52 0.24 49.73% 133.32 16.25% 1.99 110.82 5.28 75.38 40.71 1.61 0.36 45.98% 106.66 12.99% 1.85 72.00 69.00 days 1.39 0.37 64.00% 4.39 20.00% 2.77 -64,359 52 137,828 -309,070 -235,549 -102,743 EM -102,743 Current Year Previous Year 7,270,965 6,543,868 5.088,078 4.580.708 2,182,887 1,963,160 1,648,000 1,483,200 534,887 479,960 4.012 4.500 530,875 475,460 200.484 179.557 330,391 295,903 64,359 57,641 266,032 238,262 Use Source 102,743 27758 Curr. Yr. 118,936 66,827 1,527,187 99,740 1,812,690 1,657,919 88.727 3,559,336 Prev. Yr. 221,679 94,585 1.390,767 91.767 1,798,798 1,514,138 78.768 3,391,704 136,420 7,973 143781 9959 60,663 12,127 52 ? Susie'sEmporiumFinancial Data 3 (in thousands) # Financial Statements: Current & Previous Year 5 Income Statement in thous.) Total Revenue Cost of Goods Sold 8 Gross Profit Selling & Administrative Costs o Earnings Before Interest & Taxes 1 Interest Expense 2 Earnings Before Taxes 3 Income Tax Expense 4 Net Income 5 Dividend Paid 6 Addition to Ret. Erngs 7 8 Balance Sheet (in thous.) 9 Assets: o Cash 1 Accounts Receivable 2 Inventory 3 Other Current Assets 4 Total Current Assets 5 Net PP&E 6 Other Long-term Assets 7 Total Assets 8 Liabilities & Equity: 9 Accts. Payable o Accrued Liabilities 1 Notes Payable 2 Total Curr. Liabs. 3 Long-term Debt 4 Total Debt 5 Common Stock 6 Retained Earnings 7 Total Equity 8 Total Debt & Equity 9 o Indirect Cash Flow Statement for Curr. Year -1 Cash Flow from Operations: 2 Net Income -3 Depreciation Expense 4 Adjustments for Cash Not Received or Paid 5 Plus Decline in Accounts Receivables -6 Less Rise in Inventory 7 Less Rise in Other Current Assets 8 Plus Rise in Accounts Payable -9 Plus Rise in Accrued Liabilities 0 Net Cash Flow from Operations 1 Cash Used for Investments: 2 Change in Gross Fixed Assets 3 (calculated as Change NPPE + Depr. Expense) 4 Net Cash Used for Investments 5 Cash from Financing 6 Less Dividends Paid 7 Rise in Notes Payable (i.e. new notes payable) 8 Rise in Long-term Debt 9 Faill in Common Stock (i.e. stock buy-back) 0 Net Cash from Financing -1 Change in Cash: CFO Less CFI + CFF 2 Check: Curr. Cash Bal Less Previous Cash Bal. 3 Change in Cash Balance -4 4 578.4741 137828 1,006,700 184 386 589 1,191,675 18.45 1,770,149 51,973 1.737.214 1,789.187 3,559,336 946,037 172,259 537 1,118,833 440.646 1,559,479 361,043 1.471.182 1.832.225 3,391,704 Total S&U 309070 266,032 607,203 607,203 330,391 83.000 Financial Ratios ROE ROA NPM AU GPM OPM Fixed Asset Util. Current Year 18.47% 9.28% 4.54% 2.04 30.02% 7.36% 3.07 Prev. Year 16.15% 8.72% 4.52% 1.93 30.00% 7.33% 3.03 27,758 -136,420 -7,973 60,663 12,127 369,546 Peer Ave 20.64% 7.00% 5.20% 1.34 35.00% 7.50% 3.00 Peer Ave 135 days 6 days 236,740 236,740 Days Inventory Days Acct.Rec. Days Acct Pay. CashtoCashDays Current Ratio Quick Ratio Debt to Assets TIE LTDebttoAssets 109.55 3.35 72.22 40.69 1.52 0.24 49.73% 133.32 16.25% 1.99 110.82 5.28 75.38 40.71 1.61 0.36 45.98% 106.66 12.99% 1.85 72.00 69.00 days 1.39 0.37 64.00% 4.39 20.00% 2.77 -64,359 52 137,828 -309,070 -235,549 -102,743 EM -102,743
Step by Step Solution
There are 3 Steps involved in it

Get step-by-step solutions from verified subject matter experts