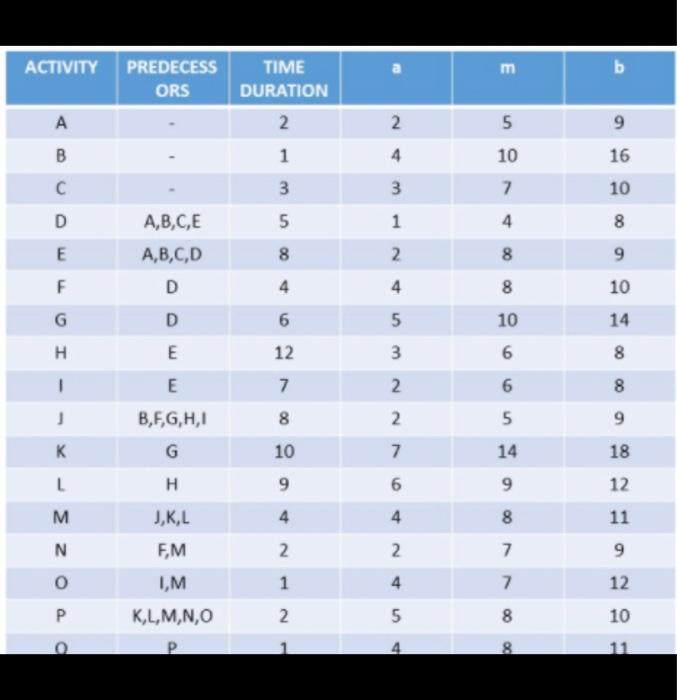
Question: E b ACTIVITY PREDECESS ORS A B TIME DURATION 2. 2. 9 5 10 4. 16 1 3 3 7 10 D A,B,C,E 5 1

E b ACTIVITY PREDECESS ORS A B TIME DURATION 2.
E b ACTIVITY PREDECESS ORS A B TIME DURATION 2. 2. 9 5 10 4. 16 1 3 3 7 10 D A,B,C,E 5 1 4 8 E 8 2 8 9 A,B,C,D D F 4 4 8 10 D 6 5 10 14 H E 12 3 6 1 7 2 6 E B,F,G,H,1 8 9 8 2 5 K G 10 7 14 L H 9 6 9 18 12 11 M J,KL 4 4 8 FM 2 2 7 IM 1 4 7 z od 9 12 10 K,L,M,N,O 2 5 8 4 8 Analyze the given tabular data and do the following: 2. PERT analysis a. Draw an AON diagram b. Identify each path and path duration c. Compute for Expected time and Path Total d. Identify the critical path e. Compute for project variance f. Compute for v path v poth g. Compute for the value of standard deviation z h. Draw a Probability of Project Completion curve based on the result of z value and probability time completion value

Step by Step Solution

There are 3 Steps involved in it

1 Expert Approved Answer
Step: 1 Unlock blur-text-image
Question Has Been Solved by an Expert!

Get step-by-step solutions from verified subject matter experts

Step: 2 Unlock
Step: 3 Unlock

Students Have Also Explored These Related General Management Questions!