

Question: E BusinessCourse Return to course Course Content / Week 3 Chapter 6 / Data Analytics Assignment 1 Data Analytics Assignment 1 Determining Fixed vs .
E BusinessCourse
Return to course
Course Content Week Chapter Data Analytics Assignment
Data Analytics Assignment
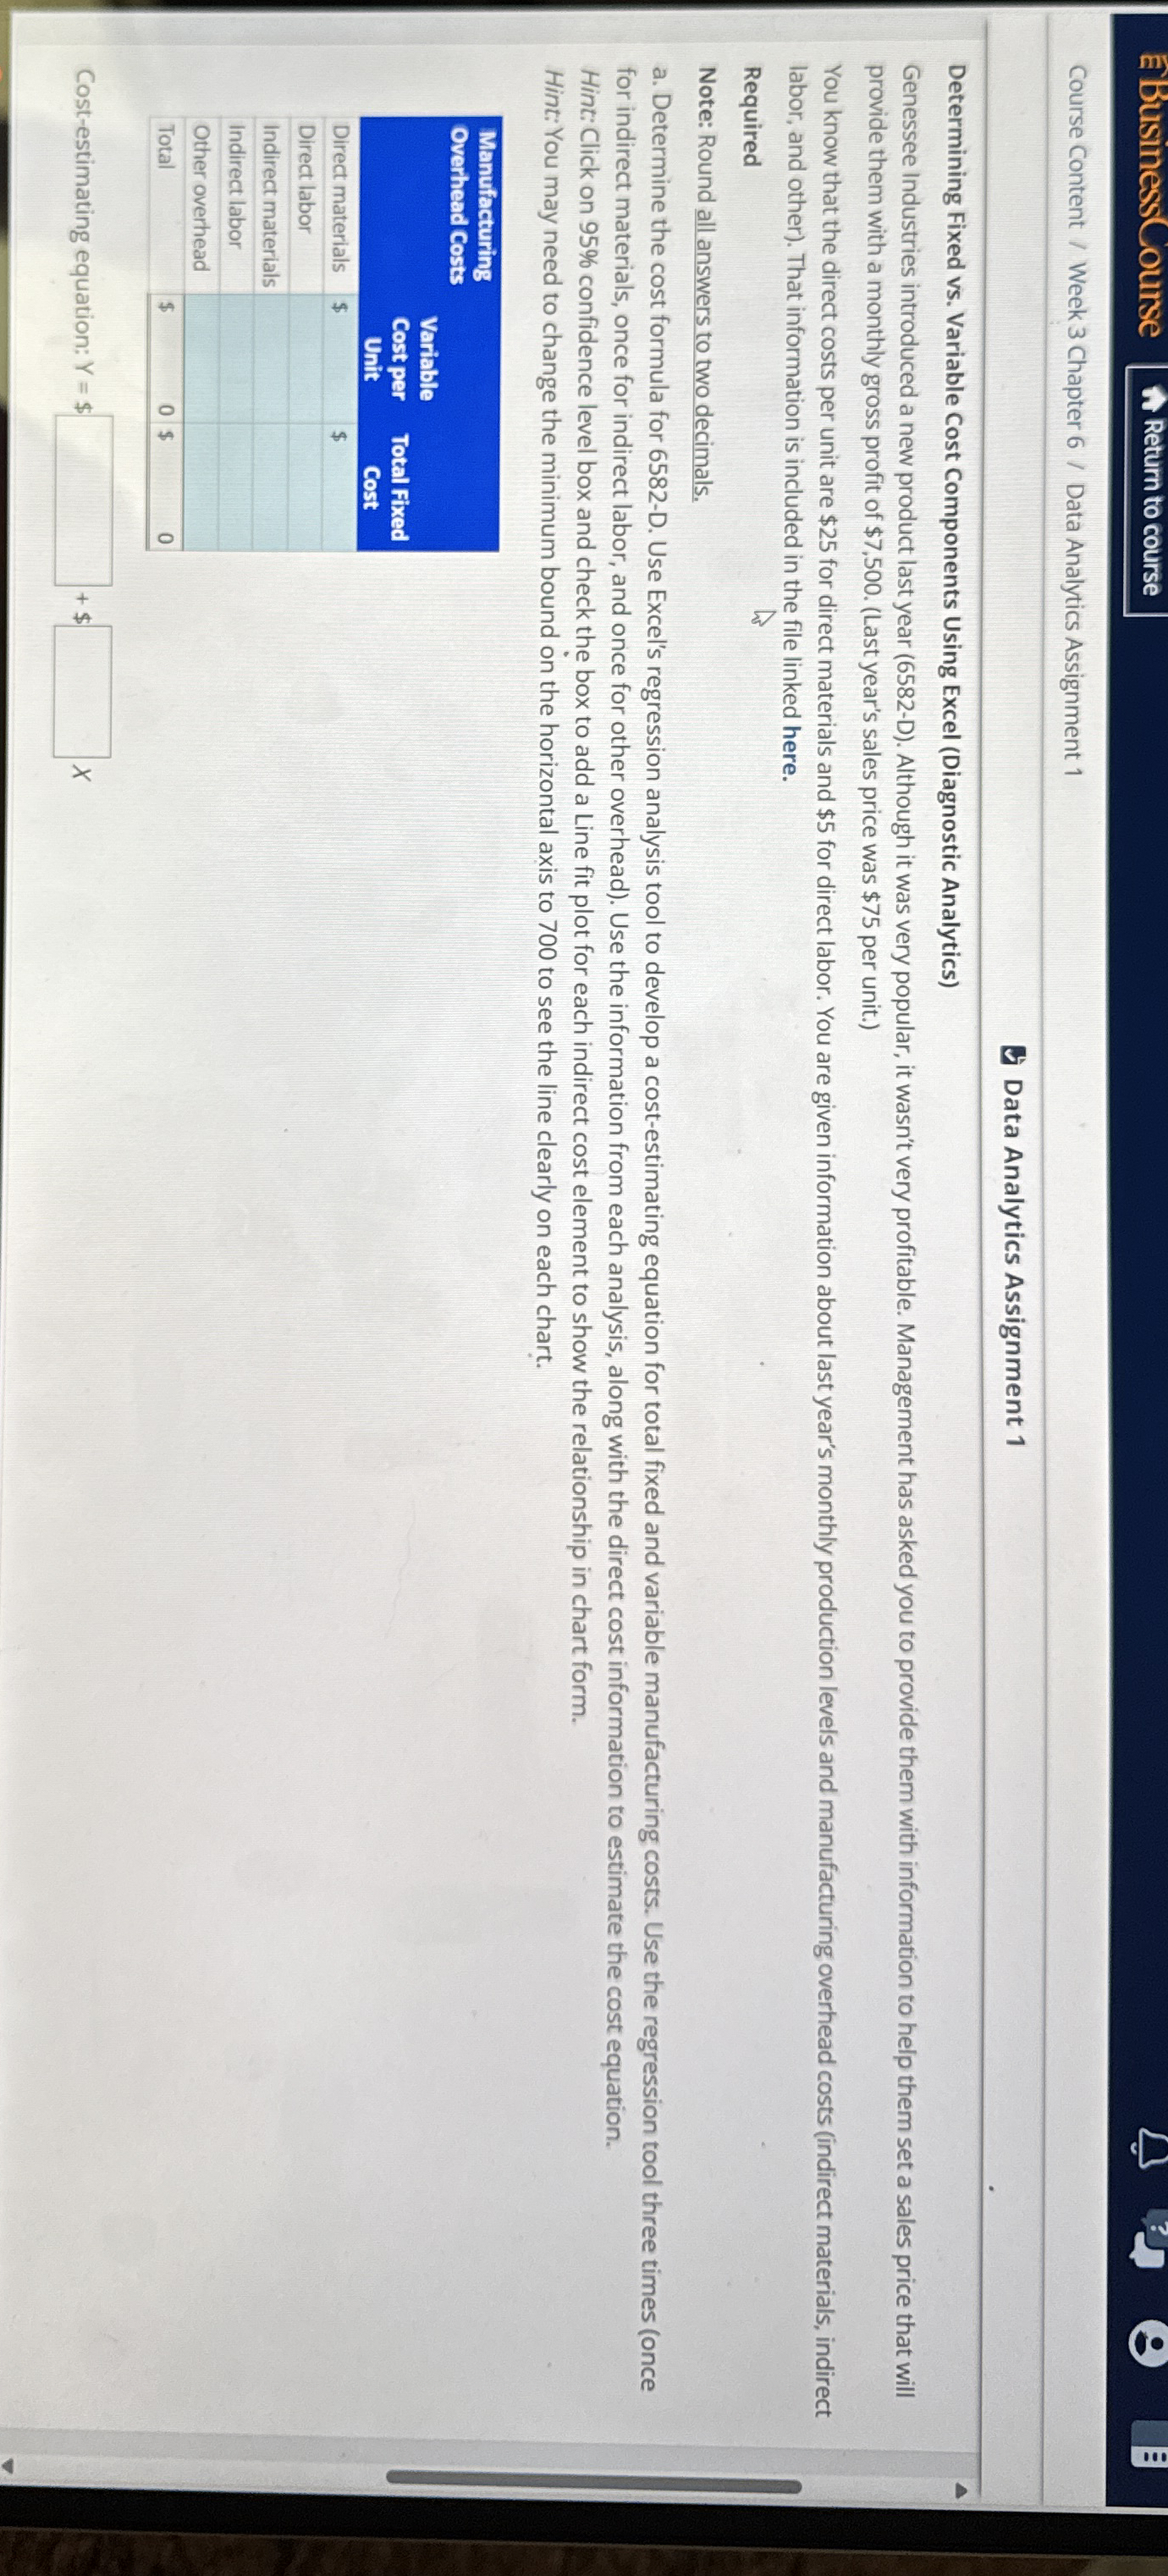
Determining Fixed vs Variable Cost Components Using Excel Diagnostic Analytics provide them with a monthly gross profit of $Last year's sales price was $ per unit. labor, and other That information is included in the file linked here.
Required
Note: Round all answers to two decimals. for indirect materials, once for indirect labor, and once for other overhead Use the information from each analysis, along with the direct cost information to estimate the cost equation.
Hint: Click on confidence level box and check the box to add a Line fit plot for each indirect cost element to show the relationship in chart form.
Hint: You may need to change the minimum bound on the horizontal axis to to see the line clearly on each chart.
tabletableManufacturingOverhead CoststableVariableCost perUnittableTotal FixedCostDirect materials,$$
Step by Step Solution
There are 3 Steps involved in it
1 Expert Approved Answer
Step: 1 Unlock

Question Has Been Solved by an Expert!
Get step-by-step solutions from verified subject matter experts
Step: 2 Unlock
Step: 3 Unlock