

Question: e. Comparing the following model by using Adjusted R Square, Std. Error of the Estimate, Mallows' A D Prediction Criterion (C statistic). Finish the following

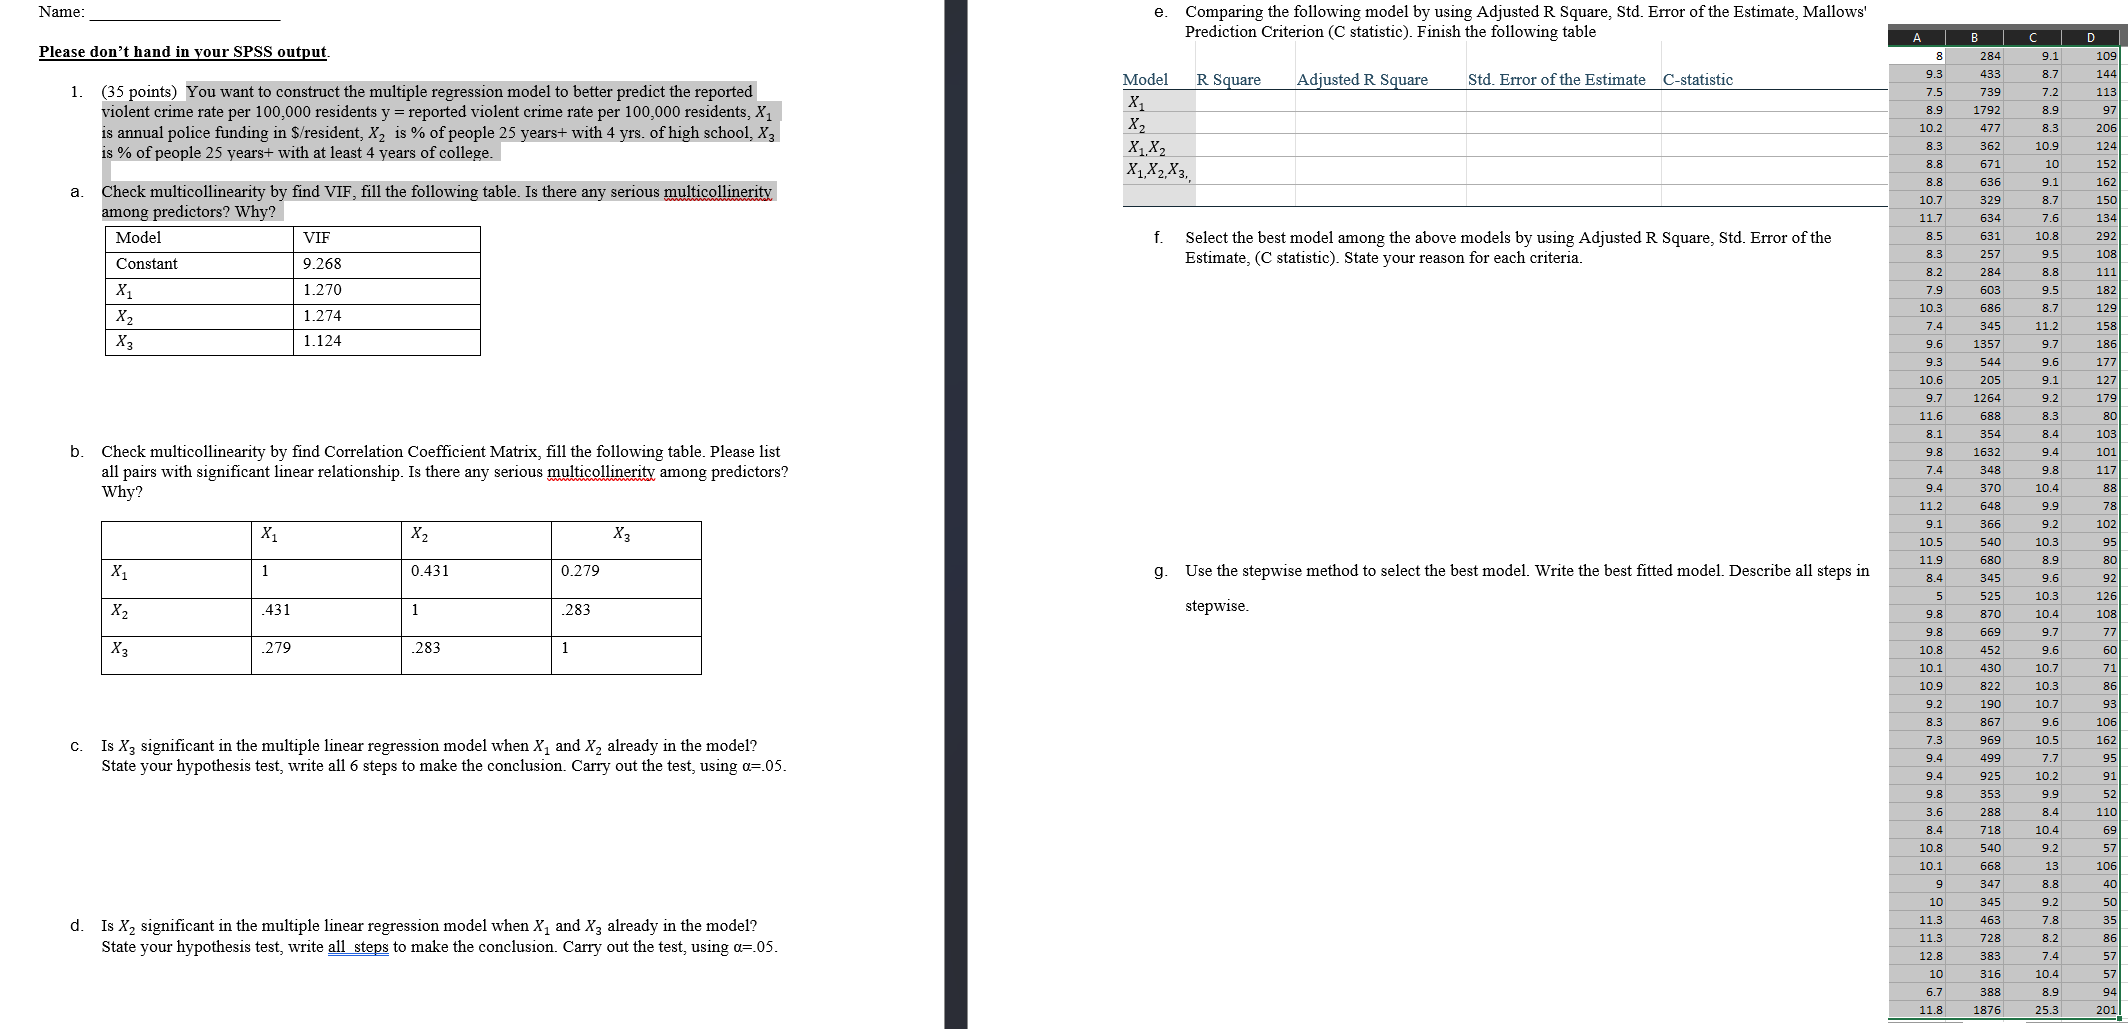
e. Comparing the following model by using Adjusted R Square, Std. Error of the Estimate, Mallows' A D Prediction Criterion (C statistic). Finish the following table 8 284 9.1 109 9.3 433 8.7 144 Name: Std. Error of the Estimate C-statistic 7.5 739 7.2 113 R Square Adjusted R Square 1792 8.9 97 Model 8.9 Please don't hand in your SPSS output 8.3 X 1 10.2 477 206 362 10.9 124 (35 points) You want to construct the multiple regression model to better predict the reported X 2 8.3 8.8 10 152 1. 671 violent crime rate per 100,000 residents y = reported violent crime rate per 100,000 residents, X] X 1 X 2 8.8 636 9.1 162 is annual police funding in S/resident, X2 is % of people 25 years+ with 4 yrs. of high school, X3 X1, X2, X3, 10.7 329 8.7 150 is % of people 25 years+ with at least 4 years of college. 11.7 634 7.6 134 8.5 631 10.8 292 Check multicollinearity by find VIF, fill the following table. Is there any serious multicollinerity f. Select the best model among the above models by using Adjusted R Square, Std. Error of the 8.3 257 9.5 108 a. 8.2 284 8.8 111 among predictors? Why? Estimate, (C statistic). State your reason for each criteria. 79 603 9.5 182 Model VIF 10.3 686 8.7 129 158 Constant 9.268 7.4 345 11.2 9.6 1357 9.7 186 177 X1 1.270 9.3 544 9.6 X2 1.274 10.6 205 9.1 127 9.7 1264 9.2 179 X 3 1.124 11.6 688 8.3 80 8.1 354 8.4 103 9.8 1632 9.4 101 74 348 9.8 117 9.4 370 10.4 88 11.2 648 9.9 78 b. Check multicollinearity by find Correlation Coefficient Matrix, fill the following table. Please list 9.1 366 9.2 102 all pairs with significant linear relationship. Is there any serious multicollinerity among predictors? 10.5 540 10.3 95 680 8.9 80 Why? 11.9 8.4 345 9.6 92 g. Use the stepwise method to select the best model. Write the best fitted model. Describe all steps in 5 10.3 X X 2 X3 525 126 9.8 870 10.4 108 0.431 0.279 9.8 669 9.7 77 X1 stepwise. 10.8 452 9.6 60 -283 10.1 430 10.7 71 X , .431 10.9 822 10.3 86 190 10.7 93 9.2 279 283 Xz 8.3 867 9.6 106 7.3 969 10.5 162 94 499 7.7 95 94 925 10.2 91 9.8 353 9.9 Is X3 significant in the multiple linear regression model when X, and X2 already in the model? 3.6 288 8.4 110 State your hypothesis test, write all 6 steps to make the conclusion. Carry out the test, using a=.05. 8.4 718 10.4 69 10.8 540 9.2 57 10.1 668 13 106 9 347 8.8 40 10 345 9.2 50 11.3 463 7.8 35 11.3 728 8.2 86 12.8 383 7.4 10 316 10.4 Is X2 significant in the multiple linear regression model when X, and X3 already in the model? 94 6.7 388 8.9 State your hypothesis test, write all steps to make the conclusion. Carry out the test, using a=.05. 11.8 1876 25.3 201
Step by Step Solution
There are 3 Steps involved in it

Get step-by-step solutions from verified subject matter experts