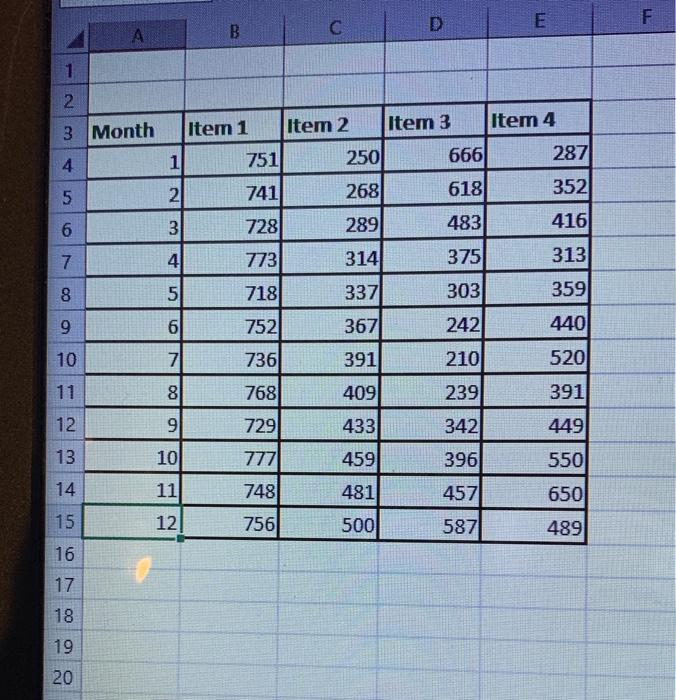
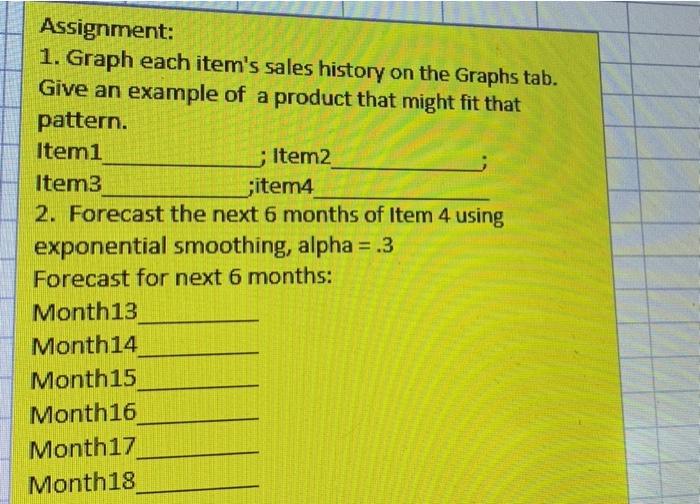
Question: E D E F B 1 2 2 3 Month Item 1 Item 2 Item 3 Item 4 751 250 666 287 4 1 5

E D E F B 1 2 2 3 Month Item 1 Item 2 Item 3 Item
E D E F B 1 2 2 3 Month Item 1 Item 2 Item 3 Item 4 751 250 666 287 4 1 5 741 N 268 618 352 3 6 728 289 483 416 3 4 5 7 4 773 314 375 313 8 5 718) 337 303 359 9 6 752 367 242 440 10 7 736 391 210 520 11 8 768 409 239 391 12 9 729 433 342 449 550 13 10 777 459 396 14 1 11 748 481 457 650 15 12 756 500 5871 489 16 17 18 19 2 20 Assignment: 1. Graph each item's sales history on the Graphs tab. Give an example of a product that might fit that pattern. Item1 Item2 Item3 item4 2. Forecast the next 6 months of Item 4 using exponential smoothing, alpha = .3 Forecast for next 6 months: Month13 Month14 Month15 Month16 Month17 Month18 4. Determin error and bias of forecast: MAD MAPE TS

Step by Step Solution

There are 3 Steps involved in it

1 Expert Approved Answer
Step: 1 Unlock blur-text-image
Question Has Been Solved by an Expert!

Get step-by-step solutions from verified subject matter experts

Step: 2 Unlock
Step: 3 Unlock

Students Have Also Explored These Related General Management Questions!