

Question: E Going Beneath the Surface: X Going Beneath the Surface X PHE 101 Milestone One Gu X B Reading: Principles of Econ x MindTap -
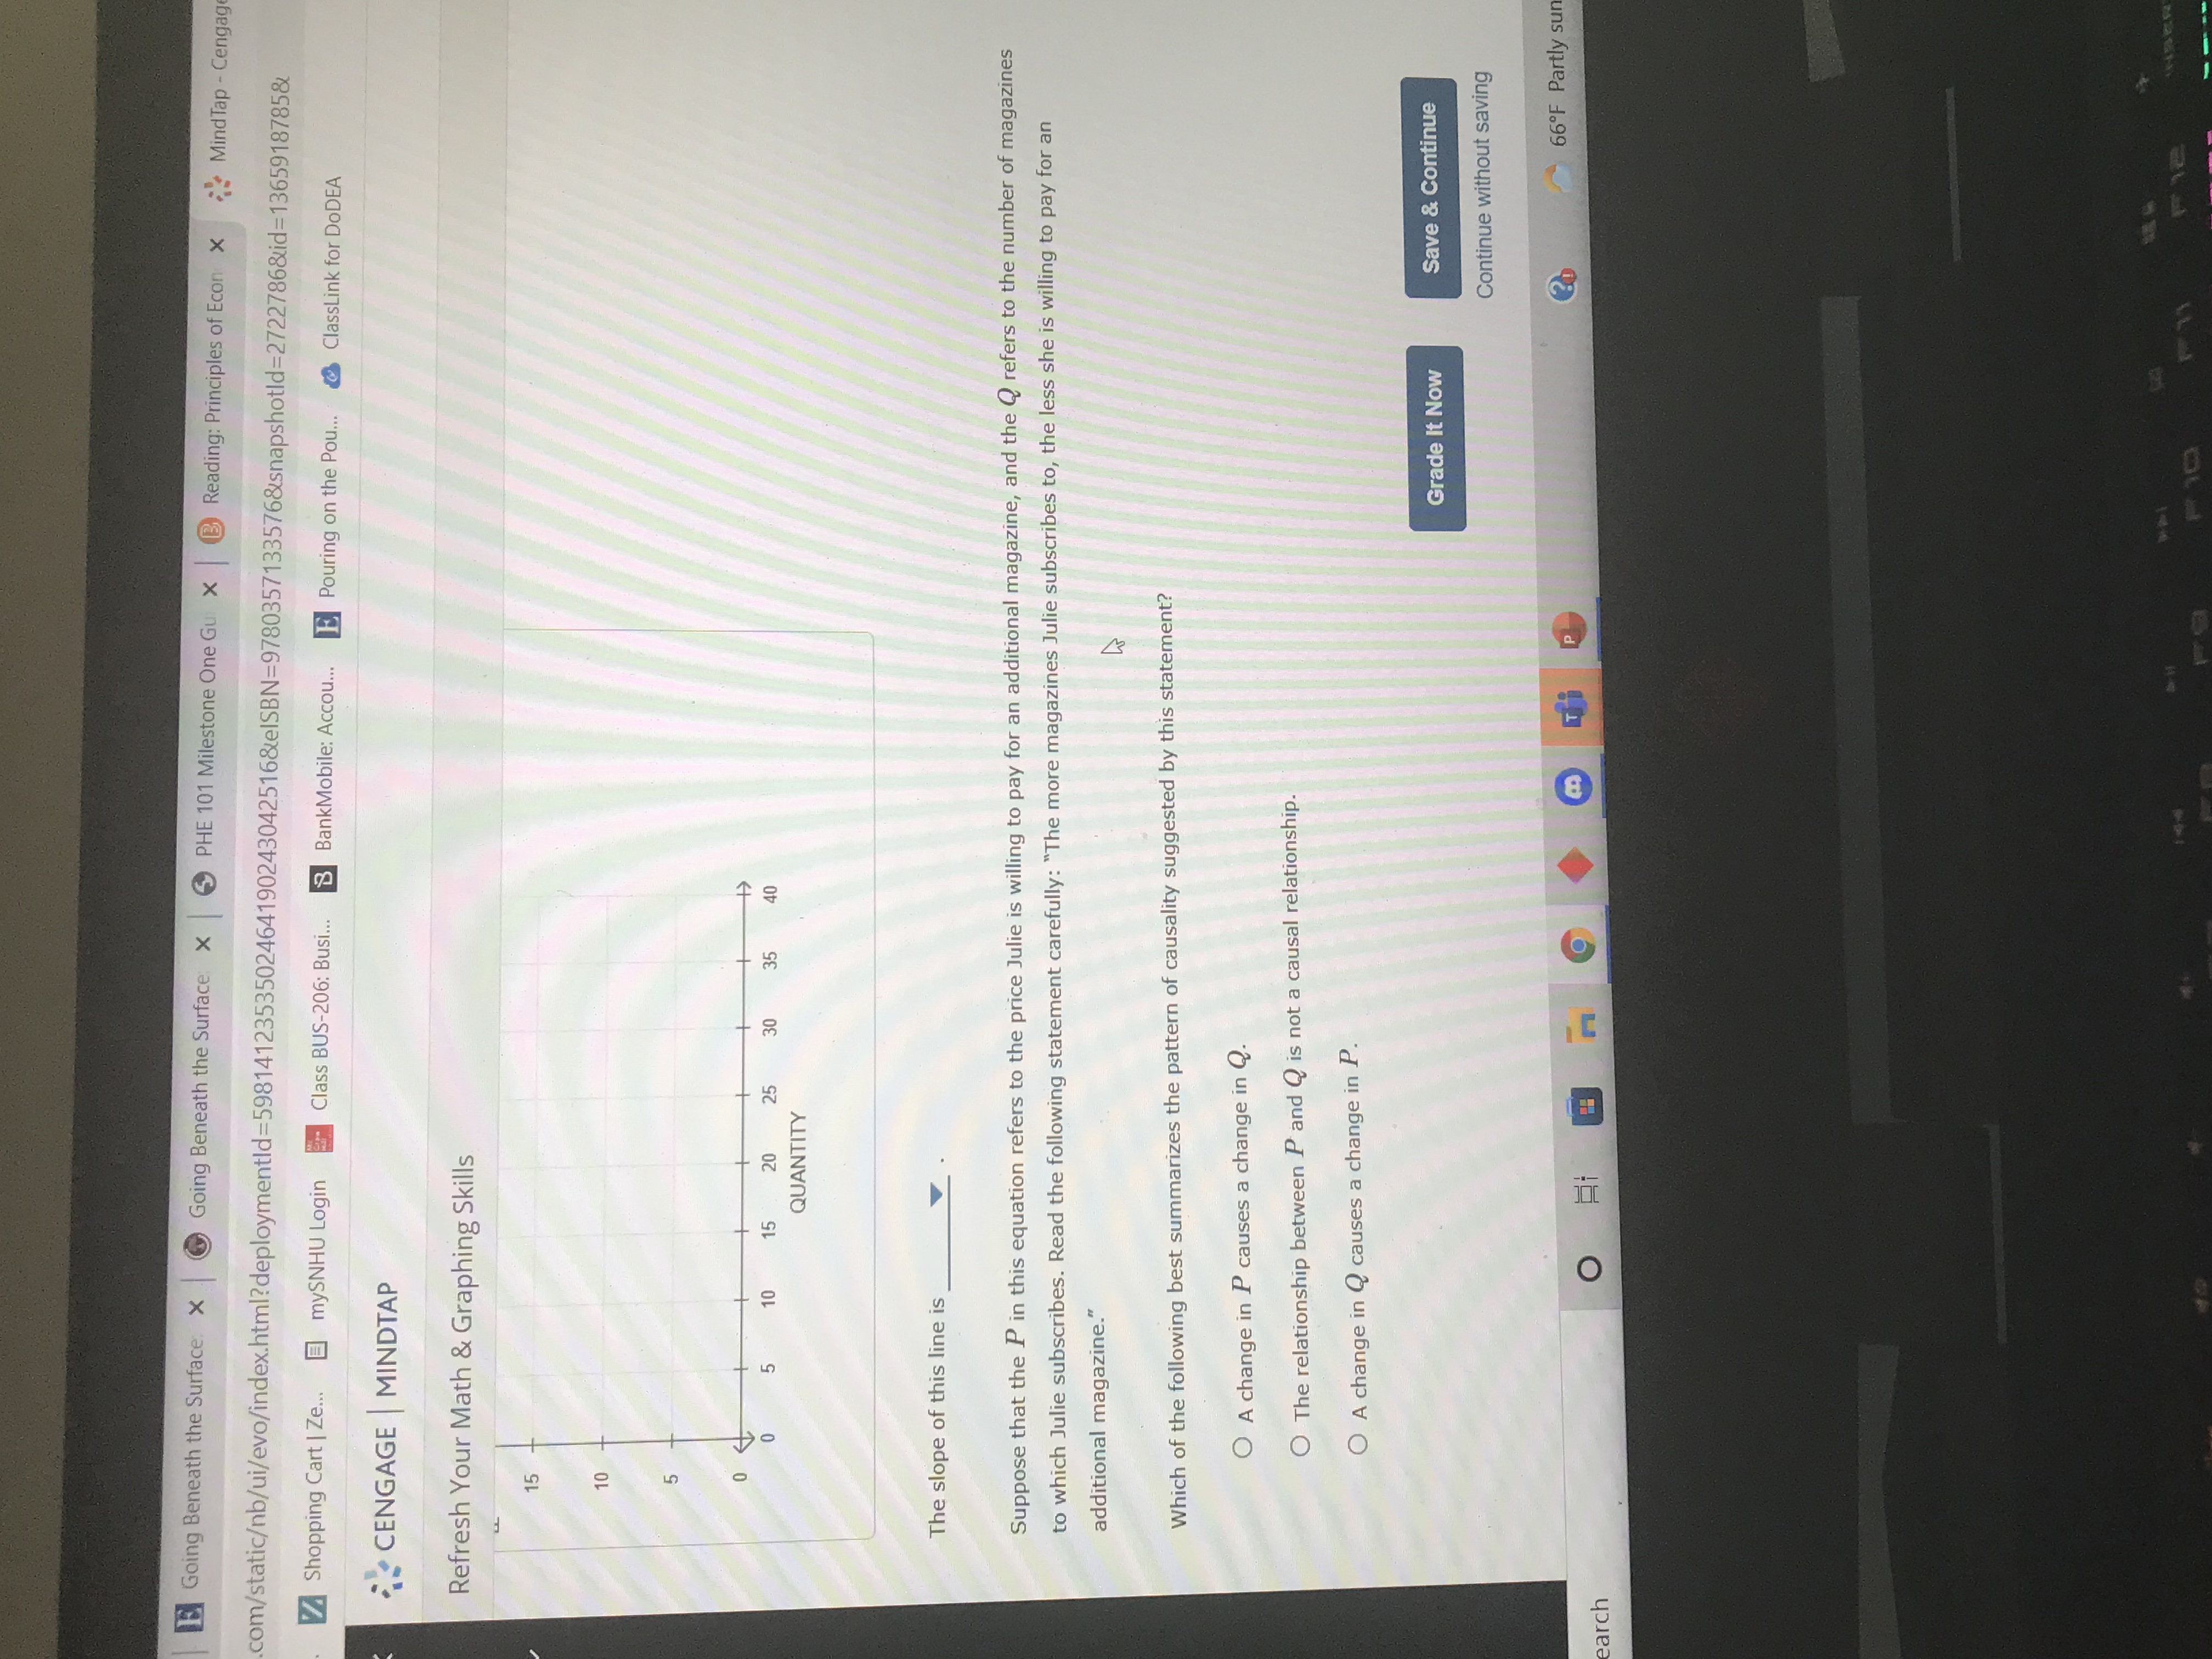
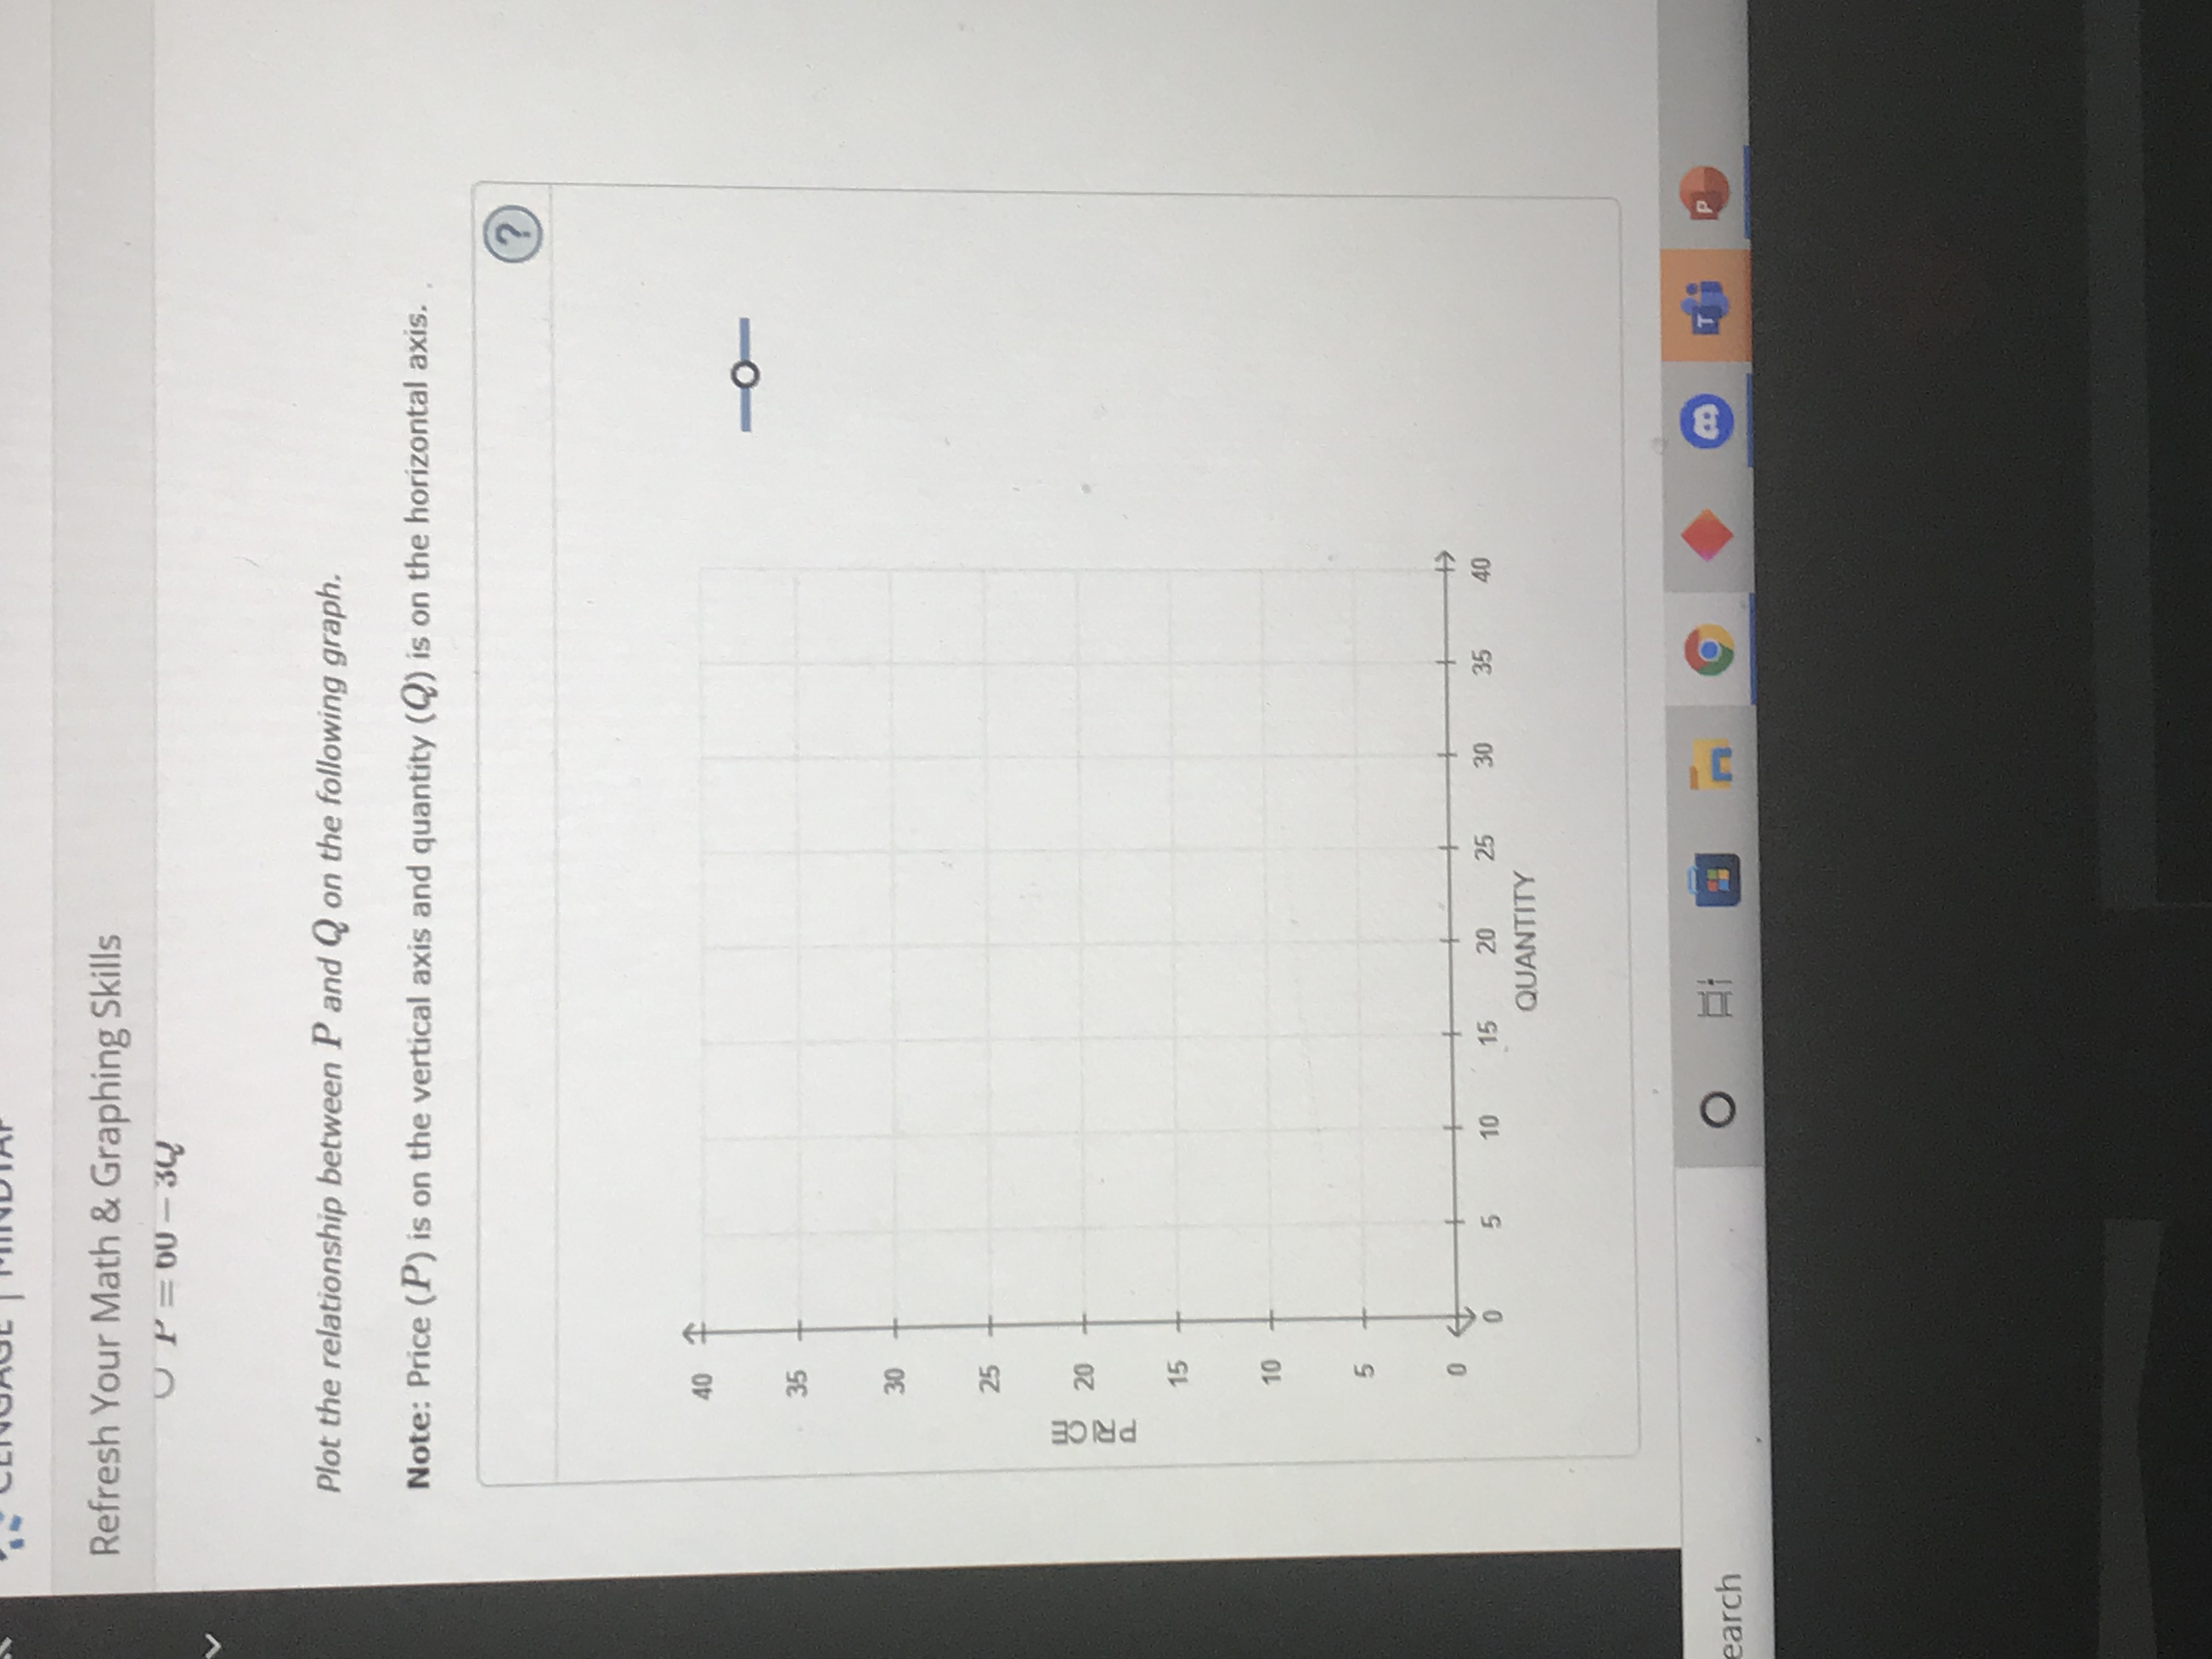


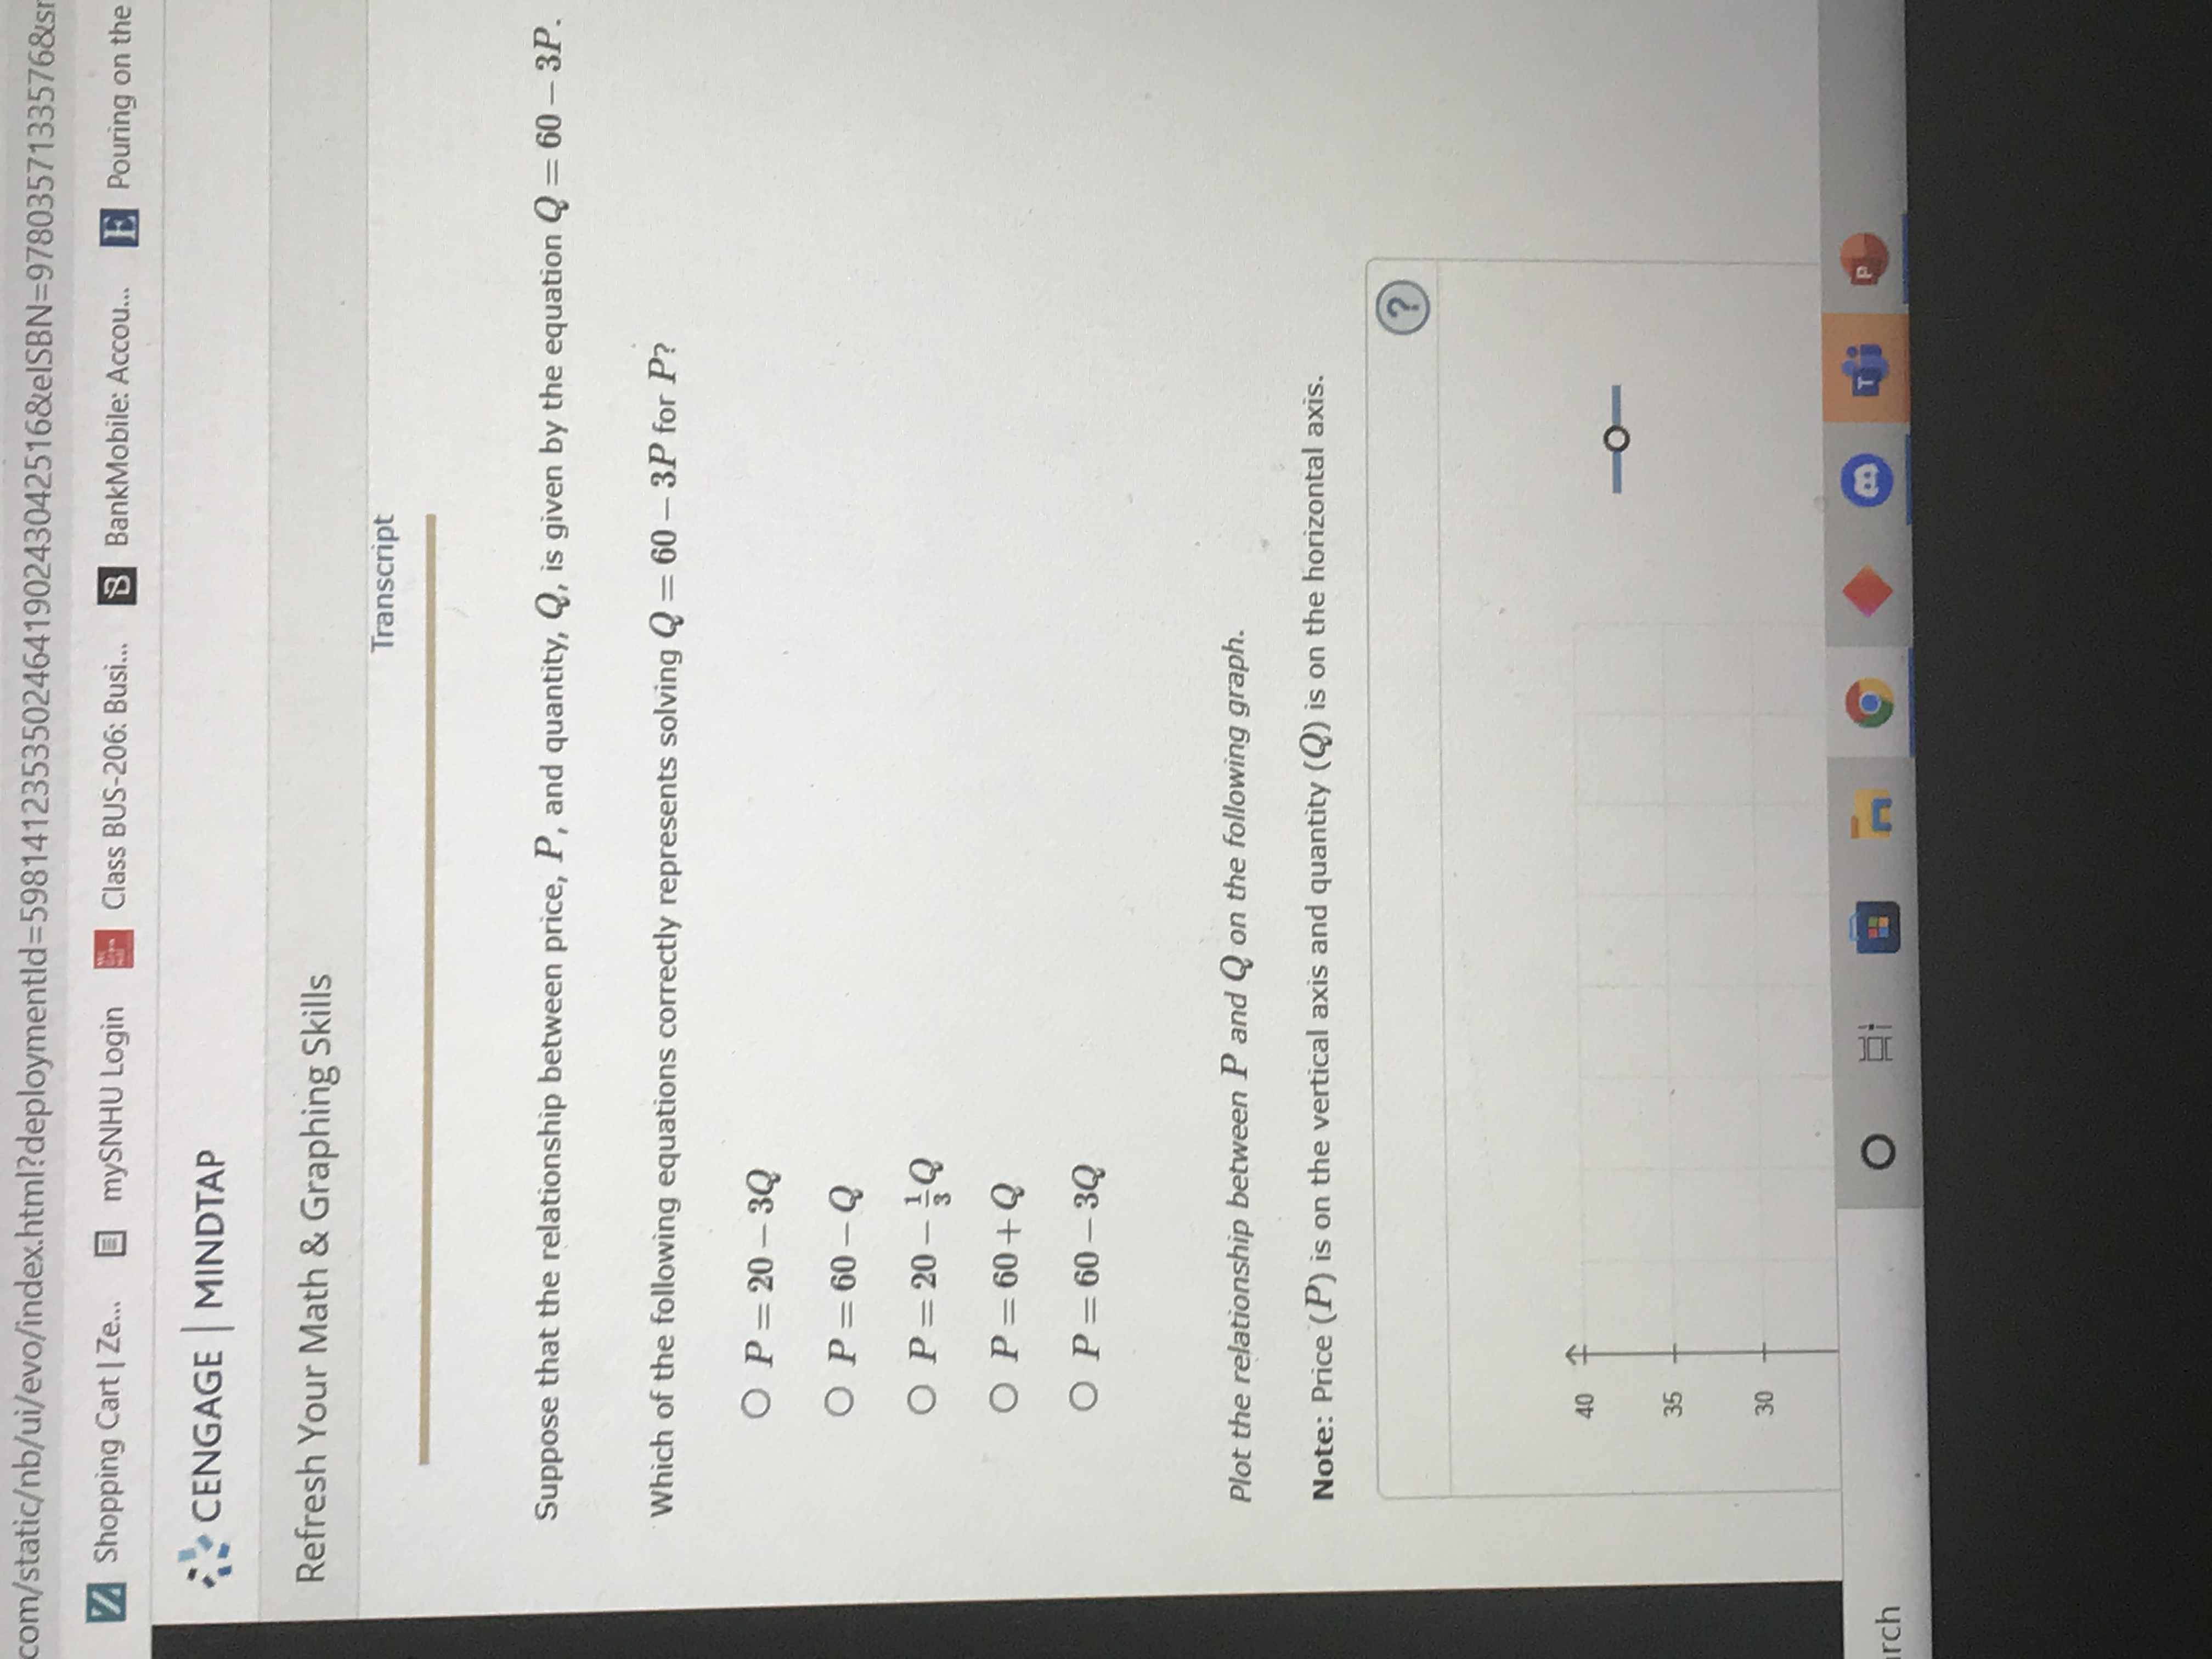
E Going Beneath the Surface: X Going Beneath the Surface X PHE 101 Milestone One Gu X B Reading: Principles of Econ x "MindTap - Cengag .com/staticb/ui/evo/index.html?deploymentld=5981412353502464190243042516&elSBN=9780357133576&snapshotld=2722786&id=1365918785& Shopping Cart | Ze. mySNHU Login Class BUS-206: Busi... 3 BankMobile: Accoupouring on the Pou... ClassLink for DoDEA CENGAGE |MINDTAP Refresh Your Math & Graphing Skills 15 10 5 10 15 20 25 30 35 40 QUANTITY The slope of this line is Suppose that the P in this equation refers to the price Julie is willing to pay for an additional magazine, and the Q refers to the number of magazines to which Julie subscribes. Read the following statement carefully: "The more magazines Julie subscribes to, the less she is willing to pay for an additional magazine." Which of the following best summarizes the pattern of causality suggested by this statement? O A change in P causes a change in Q. The relationship between P and Q is not a causal relationship. A change in Q causes a change in P. Grade It Now Save & Continue Continue without saving n m P 66 F Partly sun earch O 10Refresh Your Math & Graphing Skills UP= 00 - 34 Plot the relationship between P and Q on the following graph. Note: Price (P) is on the vertical axis and quantity (Q) is on the horizontal axis. 40 35 30 25 20 PRICE 15 10 5 0 5 10 15 20 25 30 35 40 QUANTITY earch O O T Pcom/staticb/ui/evo/index.html?deploymentld=5981412353502464190243042516&elSBN=9780357133576&s Shopping Cart | Ze.. mySNHU Login Class BUS-206: Busi. 3 BankMobile: Accou E Pouring on the CENGAGE | MINDTAP Refresh Your Math & Graphing Skills Transcript Suppose that the relationship between price, P, and quantity, Q, is given by the equation Q = 60 - 3P. Which of the following equations correctly represents solving Q = 60 - 3P for P? O P =20 - 3Q O P =60 - Q O P= 20 - 1Q O P = 60 + Q O P =60 -3Q Plot the relationship between P and Q on the following graph. Note: Price (P) is on the vertical axis and quantity (Q) is on the horizontal axis. ? 40 -0- 35 30 T irch O i P
Step by Step Solution
There are 3 Steps involved in it

Get step-by-step solutions from verified subject matter experts