

Question: E Homework: Ch9 HW One Sample Confidence Intervals Question 18, 9.2.28-T HW Score: 87.58%, 21.02 of 24 points Part 1 of 4 O Points: 0
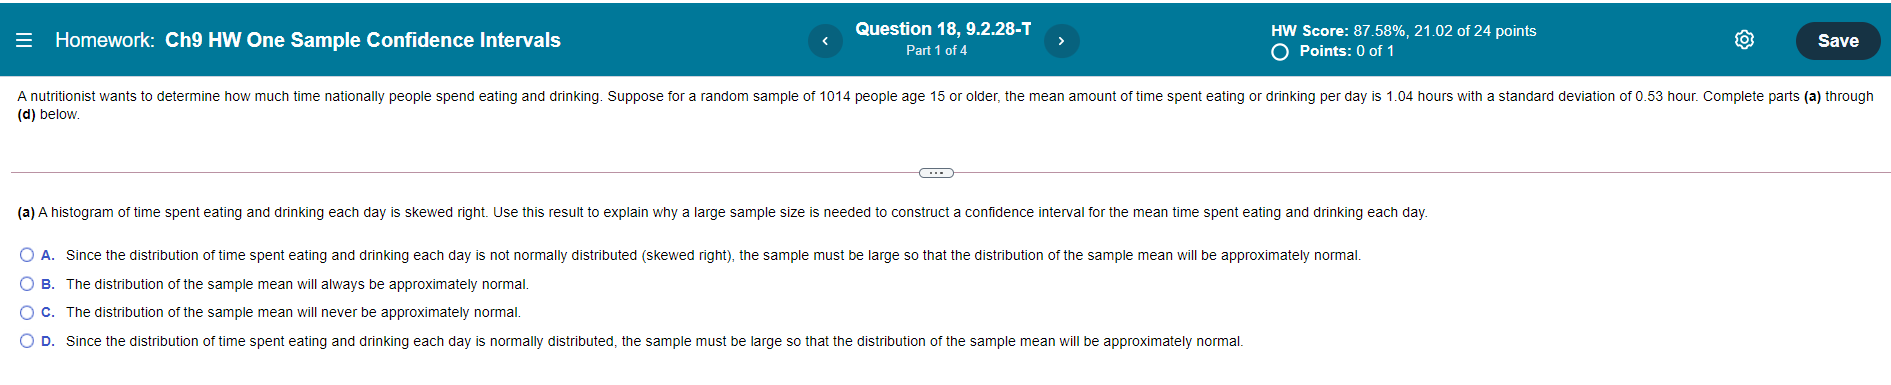

E Homework: Ch9 HW One Sample Confidence Intervals Question 18, 9.2.28-T HW Score: 87.58%, 21.02 of 24 points Part 1 of 4 O Points: 0 of 1 Save A nutritionist wants to determine how much time nationally people spend eating and drinking. Suppose for a random sample of 1014 people age 15 or older, the mean amount of time spent eating or drinking per day is 1.04 hours with a standard deviation of 0.53 hour. Complete parts (a) through (d) below. (a) A histogram of time spent eating and drinking each day is skewed right. Use this result to explain why a large sample size is needed to construct a confidence interval for the mean time spent eating and drinking each day. O A. Since the distribution of time spent eating and drinking each day is not normally distributed (skewed right), the sample must be large so that the distribution of the sample mean will be approximately normal. O B. The distribution of the sample mean will always be approximately normal. O C. The distribution of the sample mean will never be approximately normal O D. Since the distribution of time spent eating and drinking each day is normally distributed, the sample must be large so that the distribution of the sample mean will be approximately normal
Step by Step Solution
There are 3 Steps involved in it

Get step-by-step solutions from verified subject matter experts