

Question: e) is of the most importance, please provide R code, all the data is below. The data for e). Salmon Charr SurvivalOriginal SurvivalTransformed 55-75 small
e) is of the most importance, please provide R code, all the data is below.
The data for e).
| Salmon | Charr | SurvivalOriginal | SurvivalTransformed |
| 55-75 | small | 0.587 | 0.873 |
| 55-75 | small | 0.606 | 0.892 |
| 55-75 | small | 0.484 | 0.769 |
| 55-75 | medium | 0.063 | 0.254 |
| 55-75 | medium | 0.161 | 0.413 |
| 55-75 | medium | 0.002 | 0.045 |
| 55-75 | large | 0.009 | 0.095 |
| 55-75 | large | 0.002 | 0.045 |
| 55-75 | large | 0.002 | 0.045 |
| 80-100 | small | 0.568 | 0.854 |
| 80-100 | small | 0.684 | 0.974 |
| 80-100 | small | 0.909 | 1.264 |
| 80-100 | medium | 0.455 | 0.74 |
| 80-100 | medium | 0.477 | 0.762 |
| 80-100 | medium | 0.293 | 0.572 |
| 80-100 | large | 0.185 | 0.445 |
| 80-100 | large | 0.035 | 0.188 |
| 80-100 | large | 0.072 | 0.272 |
| 105-125 | small | 0.948 | 1.341 |
| 105-125 | small | 0.881 | 1.219 |
| 105-125 | small | 0.923 | 1.29 |
| 105-125 | medium | 0.941 | 1.325 |
| 105-125 | medium | 0.718 | 1.011 |
| 105-125 | medium | 0.588 | 0.874 |
| 105-125 | large | 0.466 | 0.751 |
| 105-125 | large | 0.908 | 1.263 |
| 105-125 | large | 0.632 | 0.919 |
| 130-150 | small | 1 | 1.571 |
| 130-150 | small | 1 | 1.571 |
| 130-150 | small | 0.985 | 1.448 |
| 130-150 | medium | 0.961 | 1.372 |
| 130-150 | medium | 1 | 1.571 |
| 130-150 | medium | 1 | 1.571 |
| 130-150 | large | 0.953 | 1.352 |
| 130-150 | large | 0.83 | 1.146 |
| 130-150 | large | 0.855 | 1.18 |
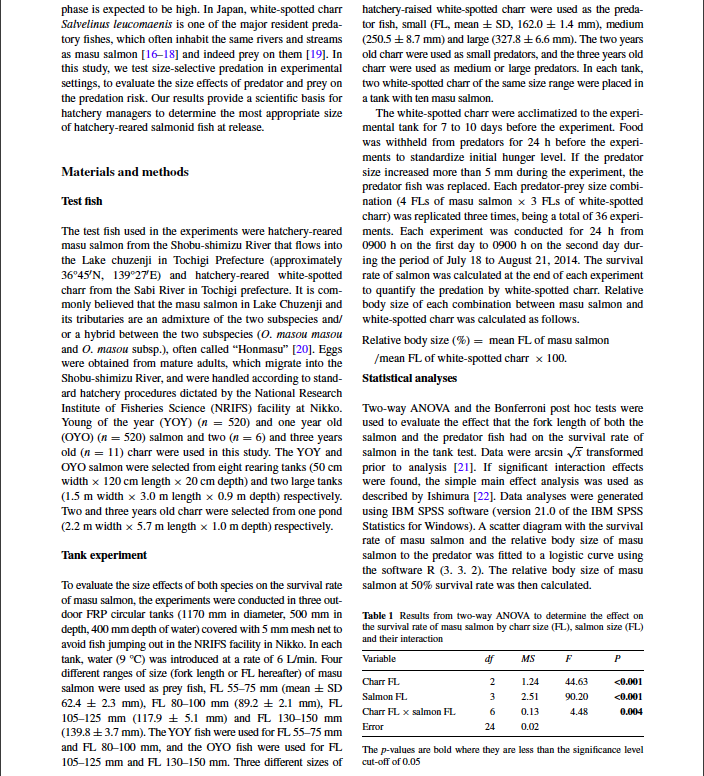
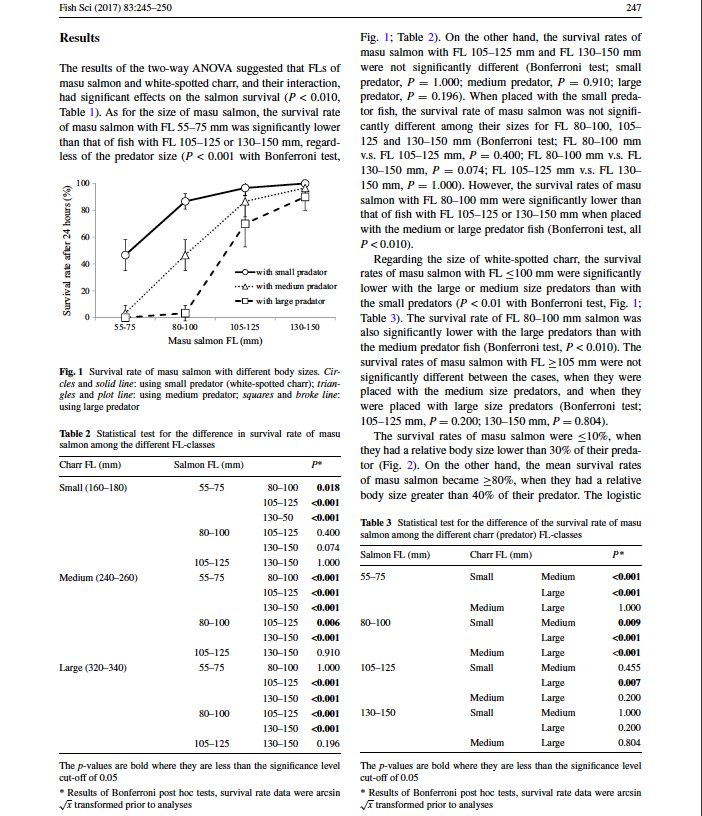
3. Focus on the post-hoc tests (multiple comparison) (p.246-247). a. In words, describe what is the goal of these tests. [1 mark] b. How many post-hoc tests are performed? Explain why. [1 mark] c. Explain the problem associated with performing a large number of tests. [1 mark] d. Using the method described in class, how would you correct the significance level? [1 mark] e. Using the same dataset as in Q2f, perform a subset of the post-hoc tests. Focus only on small salmons (FL=55-75 mm), and look at how they are affected differently by predators of varying size. As in the paper, use the transformed values. Describe your tests clearly (i.e. explain what you are comparing), the test statistic, the p-value, and the conclusion. [4 marks] phase is expected to be high. In Japan, white-spotted charr hatchery-raised white-spotted charr were used as the preda- Salvelinus leucomaenis is one of the major resident preda tor fish, small (FL, mean SD, 162.0 E 1.4 mm), medium tory fishes, which often inhabit the same rivers and streams (250.5 = 8.7 mm) and large (327.8 +6.6 mm). The two years as masu salmon [1618] and indeed prey on them [19]. Inold charr were used as small predators, and the three years old this study, we test size-selective predation in experimental charr were used as medium or large predators. In each tank, settings, to evaluate the size effects of predator and prey on two white-spotted chart of the same size range were placed in the predation risk. Our results provide a scientific basis for a tank with ten masu salmon. hatchery managers to determine the most appropriate size The white-spotted charr were acclimatized to the experi- of hatchery-reared salmonid fish at release. mental tank for 7 to 10 days before the experiment. Food was withheld from predators for 24 h before the experi- ments to standardize initial hunger level. If the predator Materials and methods size increased more than 5 mm during the experiment, the predator fish was replaced. Each predator-prey size combi- Test fish nation (4 FLs of masu salmon x 3 FLs of white-spotted charr) was replicated three times, being a total of 36 experi- The test fish used in the experiments were hatchery-reared ments. Each experiment was conducted for 24 h from masu salmon from the Shobu-shimizu River that flows into 0900 h on the first day to 0900 h on the second day dur- the Lake chuzenji in Tochigi Prefecture (approximately ing the period of July 18 to August 21, 2014. The survival 3645'N, 139027E) and hatchery-reared white-spotted rate of salmon was calculated at the end of each experiment chart from the Sabi River in Tochigi prefecture. It is com- to quantify the predation by white-spotted charr. Relative monly believed that the masu salmon in Lake Chuzenji and body size of each combination between masu salmon and its tributaries are an admixture of the two subspecies and white-spotted charr was calculated as follows. or a hybrid between the two subspecies (O. masou masou Relative body size (%) = mean FL of masu salmon and 0. masou subsp.), often called Honmasu [20]. Eggs were obtained from mature adults, which migrate into the /mean FL of white-spotted charr x 100. Shobu-shimizu River, and were handled according to stand Statistical analyses ard hatchery procedures dictated by the National Research Institute of Fisheries Science (NRIFS) facility at Nikko. Two-way ANOVA and the Bonferroni post hoc tests were Young of the year (YOY) (n = 520) and one year old used to evaluate the effect that the fork length of both the (OYO) (n = 520) salmon and two (n=6) and three years salmon and the predator fish had on the survival rate of old (n = 11) charr were used in this study. The YOY and salmon in the tank test. Data were arcsin transformed OYO salmon were selected from eight rearing tanks (50 cm prior to analysis [21]. If significant interaction effects width x 120 cm length x 20 cm depth) and two large tanks were found, the simple main effect analysis was used as (1.5 m width x 3.0 m length x 0.9 m depth) respectively. described by Ishimura [22]. Data analyses were generated Two and three years old charr were selected from one pond using IBM SPSS software (version 21.0 of the IBM SPSS (2.2 m width x 5.7 m length x 1.0 m depth) respectively. Statistics for Windows). A scatter diagram with the survival rate of masu salmon and the relative body size of masu Tank experiment salmon to the predator was fitted to a logistic curve using the software R (3. 3. 2). The relative body size of masu To evaluate the size effects of both species on the survival rate salmon at 50% survival rate was then calculated. of masu salmon, the experiments were conducted in three out- door FRP circular tanks (1170 mm in diameter, 500 mm in Table 1 Results from two-way ANOVA to determine the effect on depth, 400 mm depth of water) covered with 5 mm mesh net to the survival rate of masu salmon by charr size (FL), salmon size (FL) avoid fish jumping out in the NRIFS facility in Nikko. In each and their interaction tank, water (9 C) was introduced at a rate of 6 L/min. Four Variable different ranges of size (fork length or FL hereafter) of masu salmon were used as prey fish, FL 55-75 mm (mean SD Salmon FL 62.4 23 mm), FL 80-100 mm (89.2 + 2.1 mm), FL 105125 mm (117.9 = 5.1 mm) and FL 130-150 mm Error (139.8 3.7 mm). The YOY fish were used for FL 55-75 mm and FL 80-100 mm, and the OYO fish were used for FL The p-values are bold where they are less than the significance level 105125 mm and FL 130-150 mm. Three different sizes of cut-off of 0.05 df MS P Charr FL 2 3 6 24 1.24 2.51 0.13 44.63 90.20 4.48 105 mm were not Fig. 1 Survival rate of masu salmon with different body sizes. Cir- significantly different between the cases, when they were cles and solid line: using small predator (white-spotted charr); trian- gles and plot line: using medium predator, squares and broke line: placed with the medium size predators, and when they using large predator were placed with large size predators (Bonferroni test; 105-125 mm, P=0.200; 130-150 mm, P=0.804). Table 2 Statistical test for the difference in survival rate of masu The survival rates of masu salmon were $10%, when salmon among the different FL-classes they had a relative body size lower than 30% of their preda- Charr FL (mm) Salmon FL (mm) pe tor (Fig. 2). On the other hand, the mean survival rates Small (160-180) 55-75 of masu salmon became >80%, when they had a relative 80-100 0.018 105-125 105 mm were not Fig. 1 Survival rate of masu salmon with different body sizes. Cir- significantly different between the cases, when they were cles and solid line: using small predator (white-spotted charr); trian- gles and plot line: using medium predator, squares and broke line: placed with the medium size predators, and when they using large predator were placed with large size predators (Bonferroni test; 105-125 mm, P=0.200; 130-150 mm, P=0.804). Table 2 Statistical test for the difference in survival rate of masu The survival rates of masu salmon were $10%, when salmon among the different FL-classes they had a relative body size lower than 30% of their preda- Charr FL (mm) Salmon FL (mm) pe tor (Fig. 2). On the other hand, the mean survival rates Small (160-180) 55-75 of masu salmon became >80%, when they had a relative 80-100 0.018 105-125
Step by Step Solution
There are 3 Steps involved in it
1 Expert Approved Answer
Step: 1 Unlock

Question Has Been Solved by an Expert!
Get step-by-step solutions from verified subject matter experts
Step: 2 Unlock
Step: 3 Unlock