

Question: E K B D H M C G Salary U N Employee # Shift lame Location Region Position Experience 131 Morning Deanne Abbot Philadelphia East
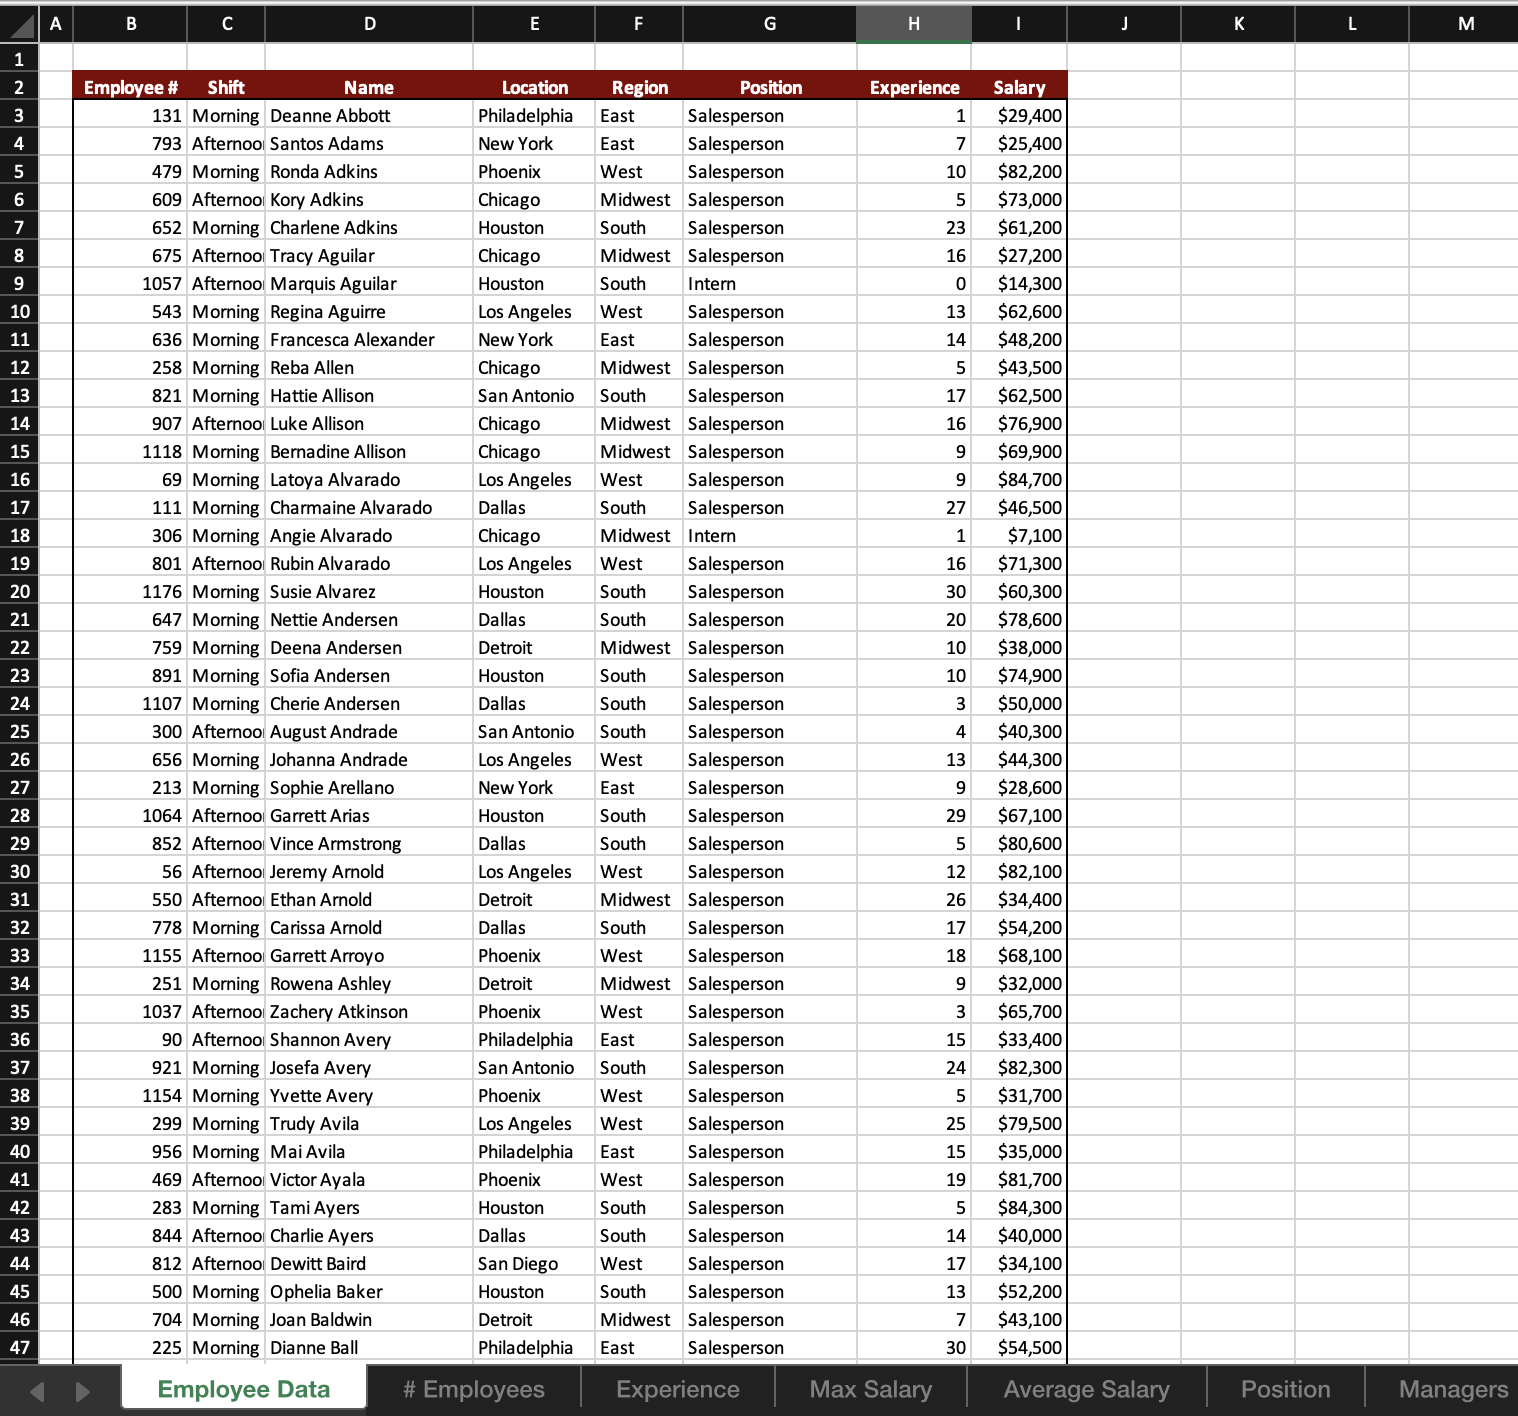
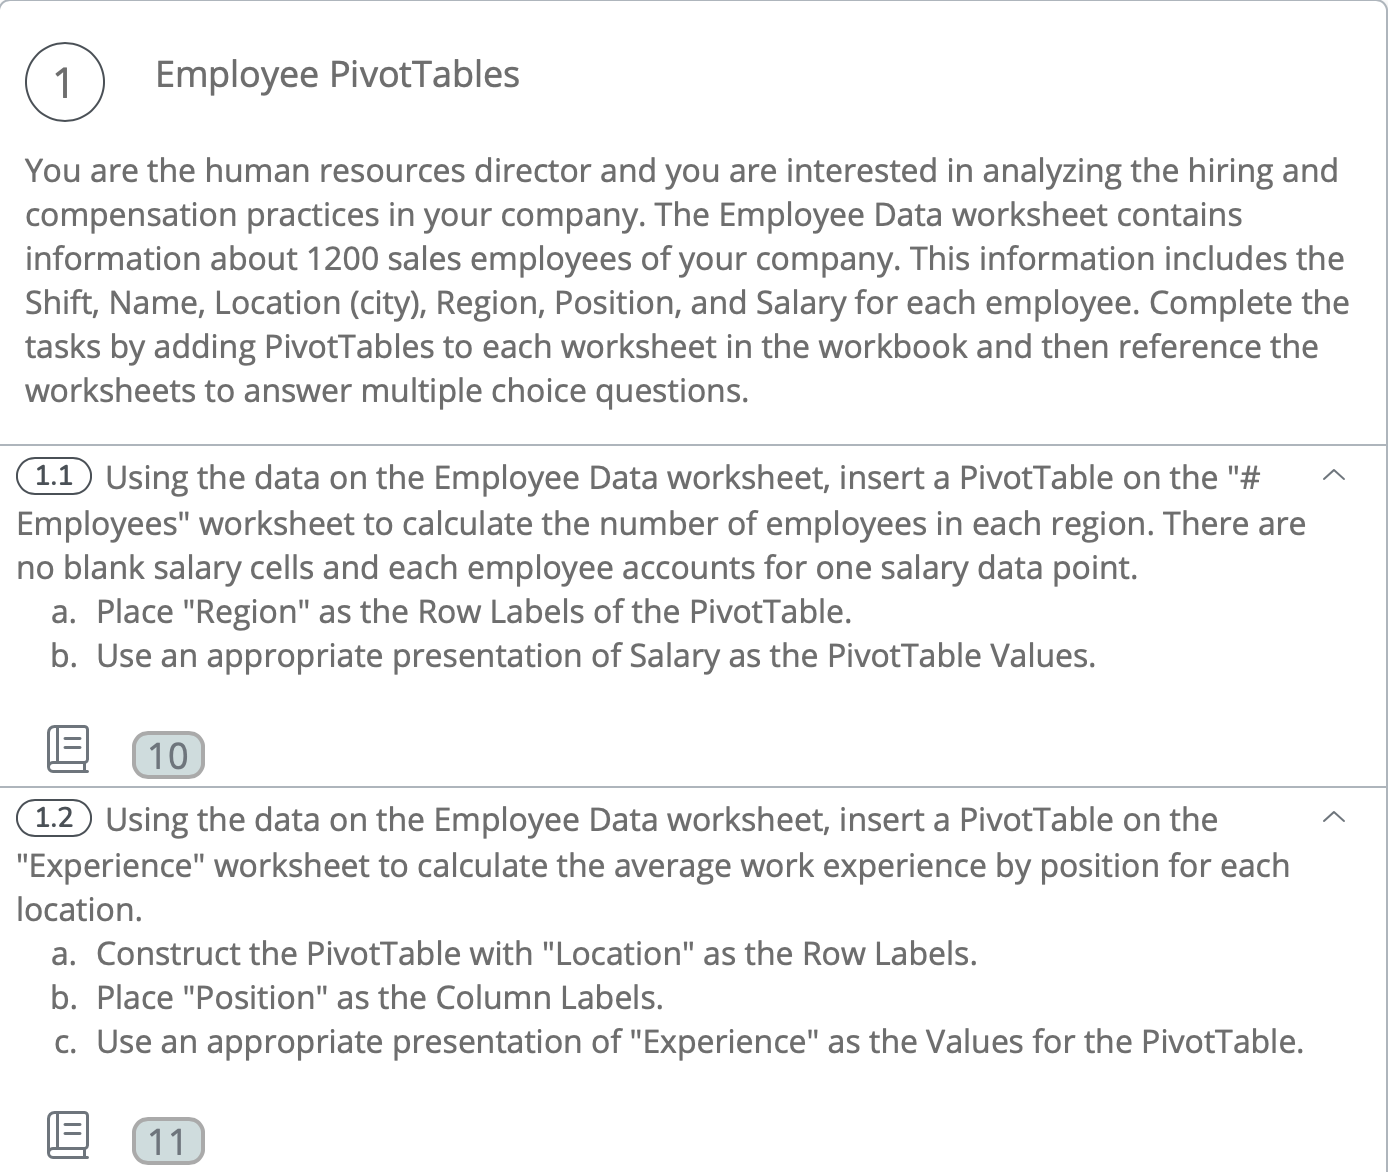
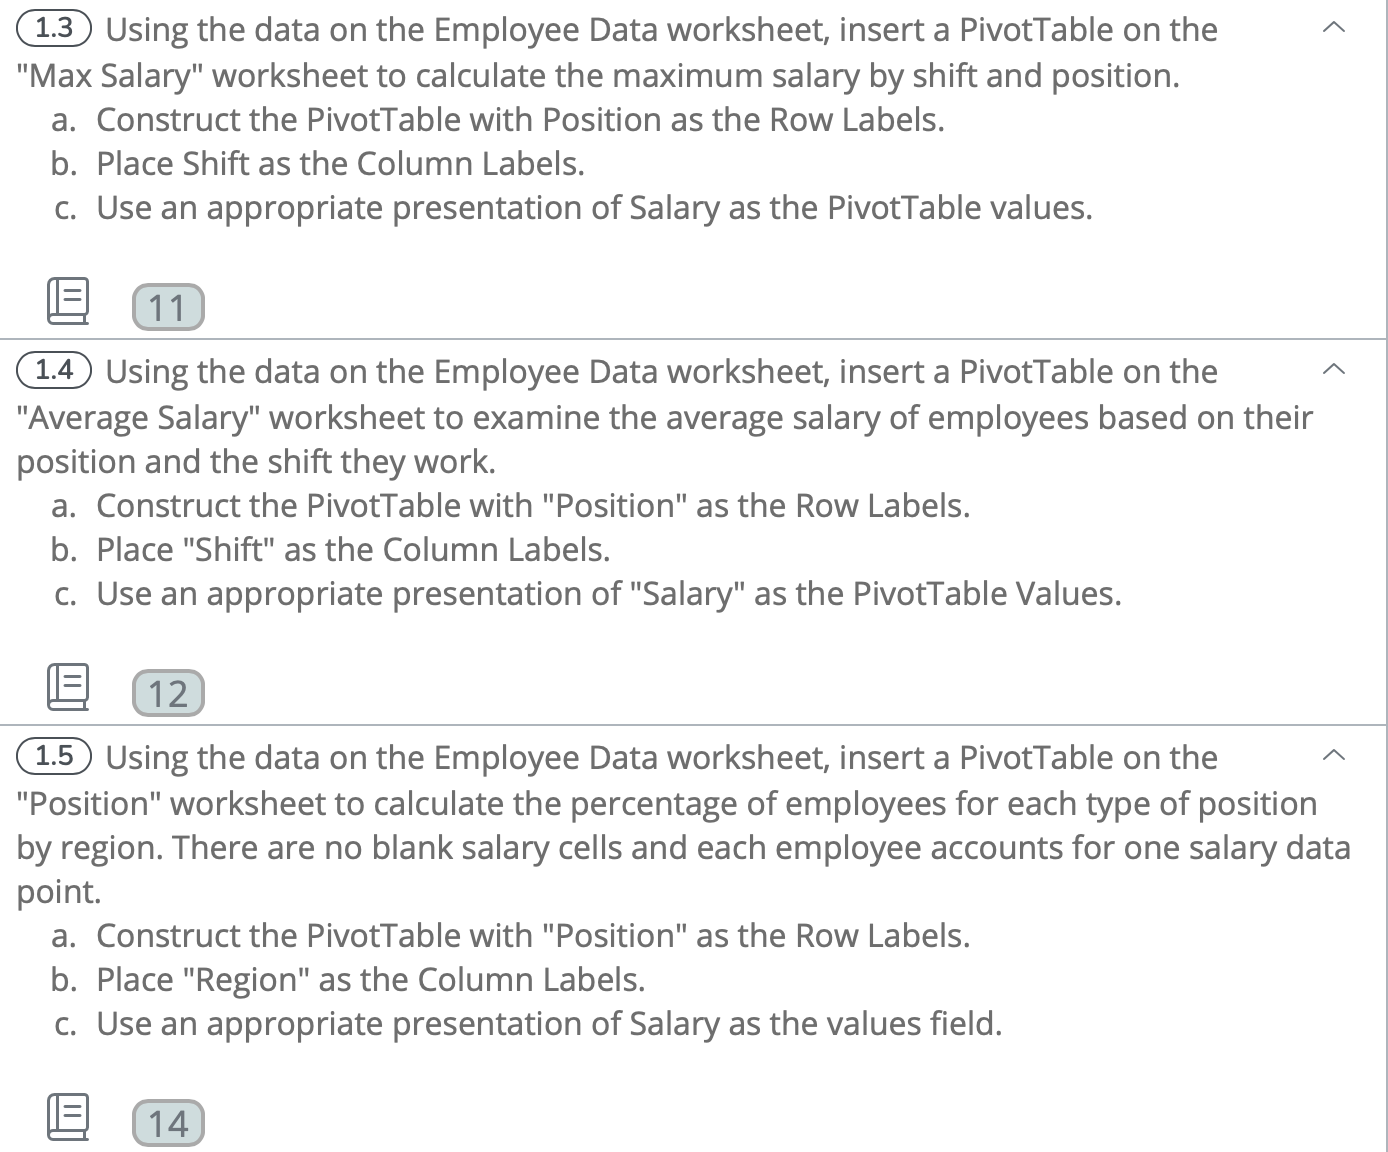
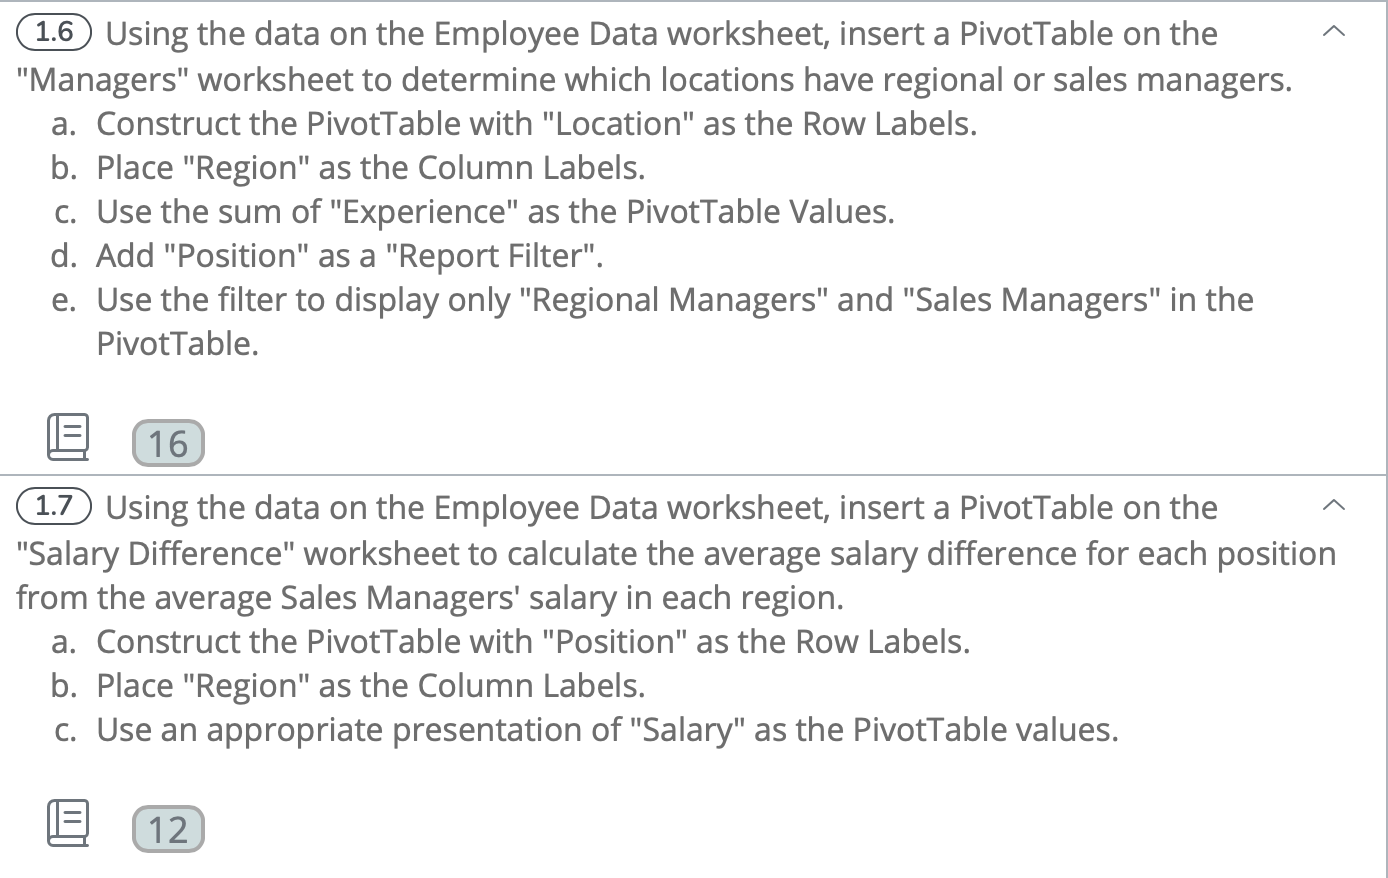


E K B D H M C G Salary U N Employee # Shift lame Location Region Position Experience 131 Morning Deanne Abbot Philadelphia East Salesperson 1 $29,400 793 Afternoo Santos Adams New York East Salesperson 7 $25,400 479 Morning Ronda Adkins Phoenix West Salesperson LO $82,200 609 Afternoon Kory Adkins Chicago Midwest Salesperson 5 $73,000 652 Morning Charlene Adkins Houston South Salesperson 23 $61,200 675 Afternoo Tracy Aguilar Chicago Midwest Salesperson 16 $27,200 1057 Afternoon Marquis Aguilar Houston South Intern 0 $14,300 543 Morning Regina Aguirre Los Angeles West Salesperson 13 $62,600 636 Morning Francesca Alexander New York East Salesperson 14 $48,200 258 Morning Reba Allen Chicago Midwest Salesperson 5 $43,500 821 Morning Hattie Allison San Antonio South Salesperson 17 $62,500 907 Afternoo Luke Allison Chicago Midwest Salesperson 16 $76,900 1118 Morning Bernadine Allison Chicago Midwest Salesperson 9 $69,900 69 Morning Latoya Alvarado Los Angeles West Salesperson 9 $84,700 111 Morning Charmaine Alvarado Dallas outh Salesperson 27 $46,500 306 Morning Angie Alvarado Chicago Midwest Intern 1 $7,100 801 Afternoo Rubin Alvarado Los Angeles West Salesperson 16 $71,300 1176 Morning Susie Alvarez Houston outh Salesperson 30 $60,300 647 Morning Nettie Andersen Dallas South Salesperson 20 $78,600 759 Morning Deena Andersen Detroit Midwest Salesperson 10 $38,000 891 Morning Sofia Andersen Houston South Salesperson 10 $74,900 1107 Morning Cherie Andersen Dallas South Salesperson 3 $50,000 300 Afternoon August Andrade San Antonio South Salesperson 4 $40,30 656 Morning Johanna Andrade Los Angeles West Salesperson 13 $44,300 213 Morning Sophie Arellano New York East Salesperson 9 $28,600 1064 Afternool Garrett Arias Houston South Salesperson 29 $67,100 852 Afternool Vince Armstrong Dallas outh Salesperson $80,600 56 Afternool Jeremy Arnol Los Angeles West Salesperson 12 $82,10 550 Afternoo Ethan Arnold Detroit Midwest Salesperson 26 $34,400 778 Morning Carissa Arnold Dalla South Salesperson 17 $54,200 1155 Afternoo Garrett Arroyo Phoenix West Salesperson 18 $68,100 251 Morning Rowena Ashley Detroit Midwest Salesperson 9 $32,000 1037 Afternoo Zachery Atkinson Phoenix West Salesperson 3 $65,700 90 Afternoo Shannon Avery Philadelphia East Salesperson 15 $33,400 921 Morning Josefa Avery San Antonio South Salesperson 24 $82,300 1154 Morning Yvette Avery Phoenix West Salesperson 5 $31,700 299 Morning Trudy Avila Los Angeles West Salesperson 25 $79,500 956 Morning Mai Avila Philadelphia East Salesperson 15 $35,000 469 Afternoo Victor Ayala Phoenix West Salesperson 19 $81,700 283 Morning Tami Ayers Houston South Salesperson 5 $84,300 844 Afternoon Charlie Ayers Dallas South Salesperson 14 $40,000 812 Afternool Dewitt Baird San Diego West Salesperson 17 $34,100 500 Morning Ophelia Baker Houston South Salesperson 13 $52,200 704 Morning Joan Baldwin Detroit Midwest Salesperson $43,100 47 225 Morning Dianne Ball Philadelphia East Salesperson 30 $54,500 Employee Data # Employees Experience Max Salary Average Salary Position Managers@ Employee PivotTables You are the human resources director and you are interested in analyzing the hiring and compensation practices in your company. The Employee Data worksheet contains information about 1200 sales employees of your company. This information includes the Shift, Name, Location (city), Region, Position, and Salaryfor each employee. Complete the tasks by adding PivotTables to each worksheet in the workbook and then reference the worksheets to answer multiple choice questions. Using the data on the Employee Data worksheet, insert a PivotTable on the "# A Employees" worksheet to calculate the number of employees in each region. There are no blank salary cells and each employee accounts for one salary data point. a. Place "Region" as the Row Labels of the PivotTable. b. Use an appropriate presentation of Salary as the PivotTable Values. [E- Using the data on the Employee Data worksheet, insert a PivotTable on the A "Experience" worksheet to calculate the average work experience by position for each location. a. Construct the PivotTable with "Location" as the Row Labels. b. Place "Position" as the Column Labels. c. Use an appropriate presentation of "Experience" as the Values for the PivotTable. ESE) @ Using the data on the Employee Data worksheet, insert a PivotTable on the A "Max Salary" worksheet to calculate the maximum salary by shift and position. a. Construct the PivotTable with Position as the Row Labels. b. Place Shift as the Column Labels. c. Use an appropriate presentation of Salary as the PivotTable values. em) Using the data on the Employee Data worksheet, insert a PivotTable on the A "Average Salary" worksheet to examine the average salary of employees based on their position and the shift they work. a. Construct the PivotTable with "Position" as the Row Labels. b. Place "Shift" as the Column Labels. c. Use an appropriate presentation of "Salary" as the PivotTable Values. [E- @ Using the data on the Employee Data worksheet, insert a PivotTable on the A I'Position" worksheet to calculate the percentage of employees for each type of position by region. There are no blank salary cells and each employee accounts for one salary data point. a. Construct the PivotTable with "Position" as the Row Labels. b. Place "Region" as the Column Labels. c. Use an appropriate presentation of Salary as the values field. [E- Using the data on the Employee Data worksheet, insert a PivotTable on the A "Managers" worksheet to determine which locations have regional or sales managers. a. Construct the PivotTable with I'Location" as the Row Labels. b. Place "Region" as the Column Labels. c. Use the sum of "Experience" as the PivotTable Values. d. Add "Position" as a "Report Filter". e. Use the lter to display only I'Regional Managers" and "Sales Managers" in the PivotTable. @- Using the data on the Employee Data worksheet, insert a PivotTable on the A "Salary Difference" worksheet to calculate the average salary difference for each position from the average Sales Managers' salary in each region. a. Construct the PivotTable with "Position" as the Row Labels. b. Place "Region" as the Column Labels. c. Use an appropriate presentation of "Salary" as the PivotTable values. [E
Step by Step Solution
There are 3 Steps involved in it

Get step-by-step solutions from verified subject matter experts