

Question: E mathxl.com 12 Do Homework , Se Math 141 - 21107 E Homework: Section 2.1-2.2: Visualizing Numerical Data Question 5, 2.1 -2.4 ) HW Score:
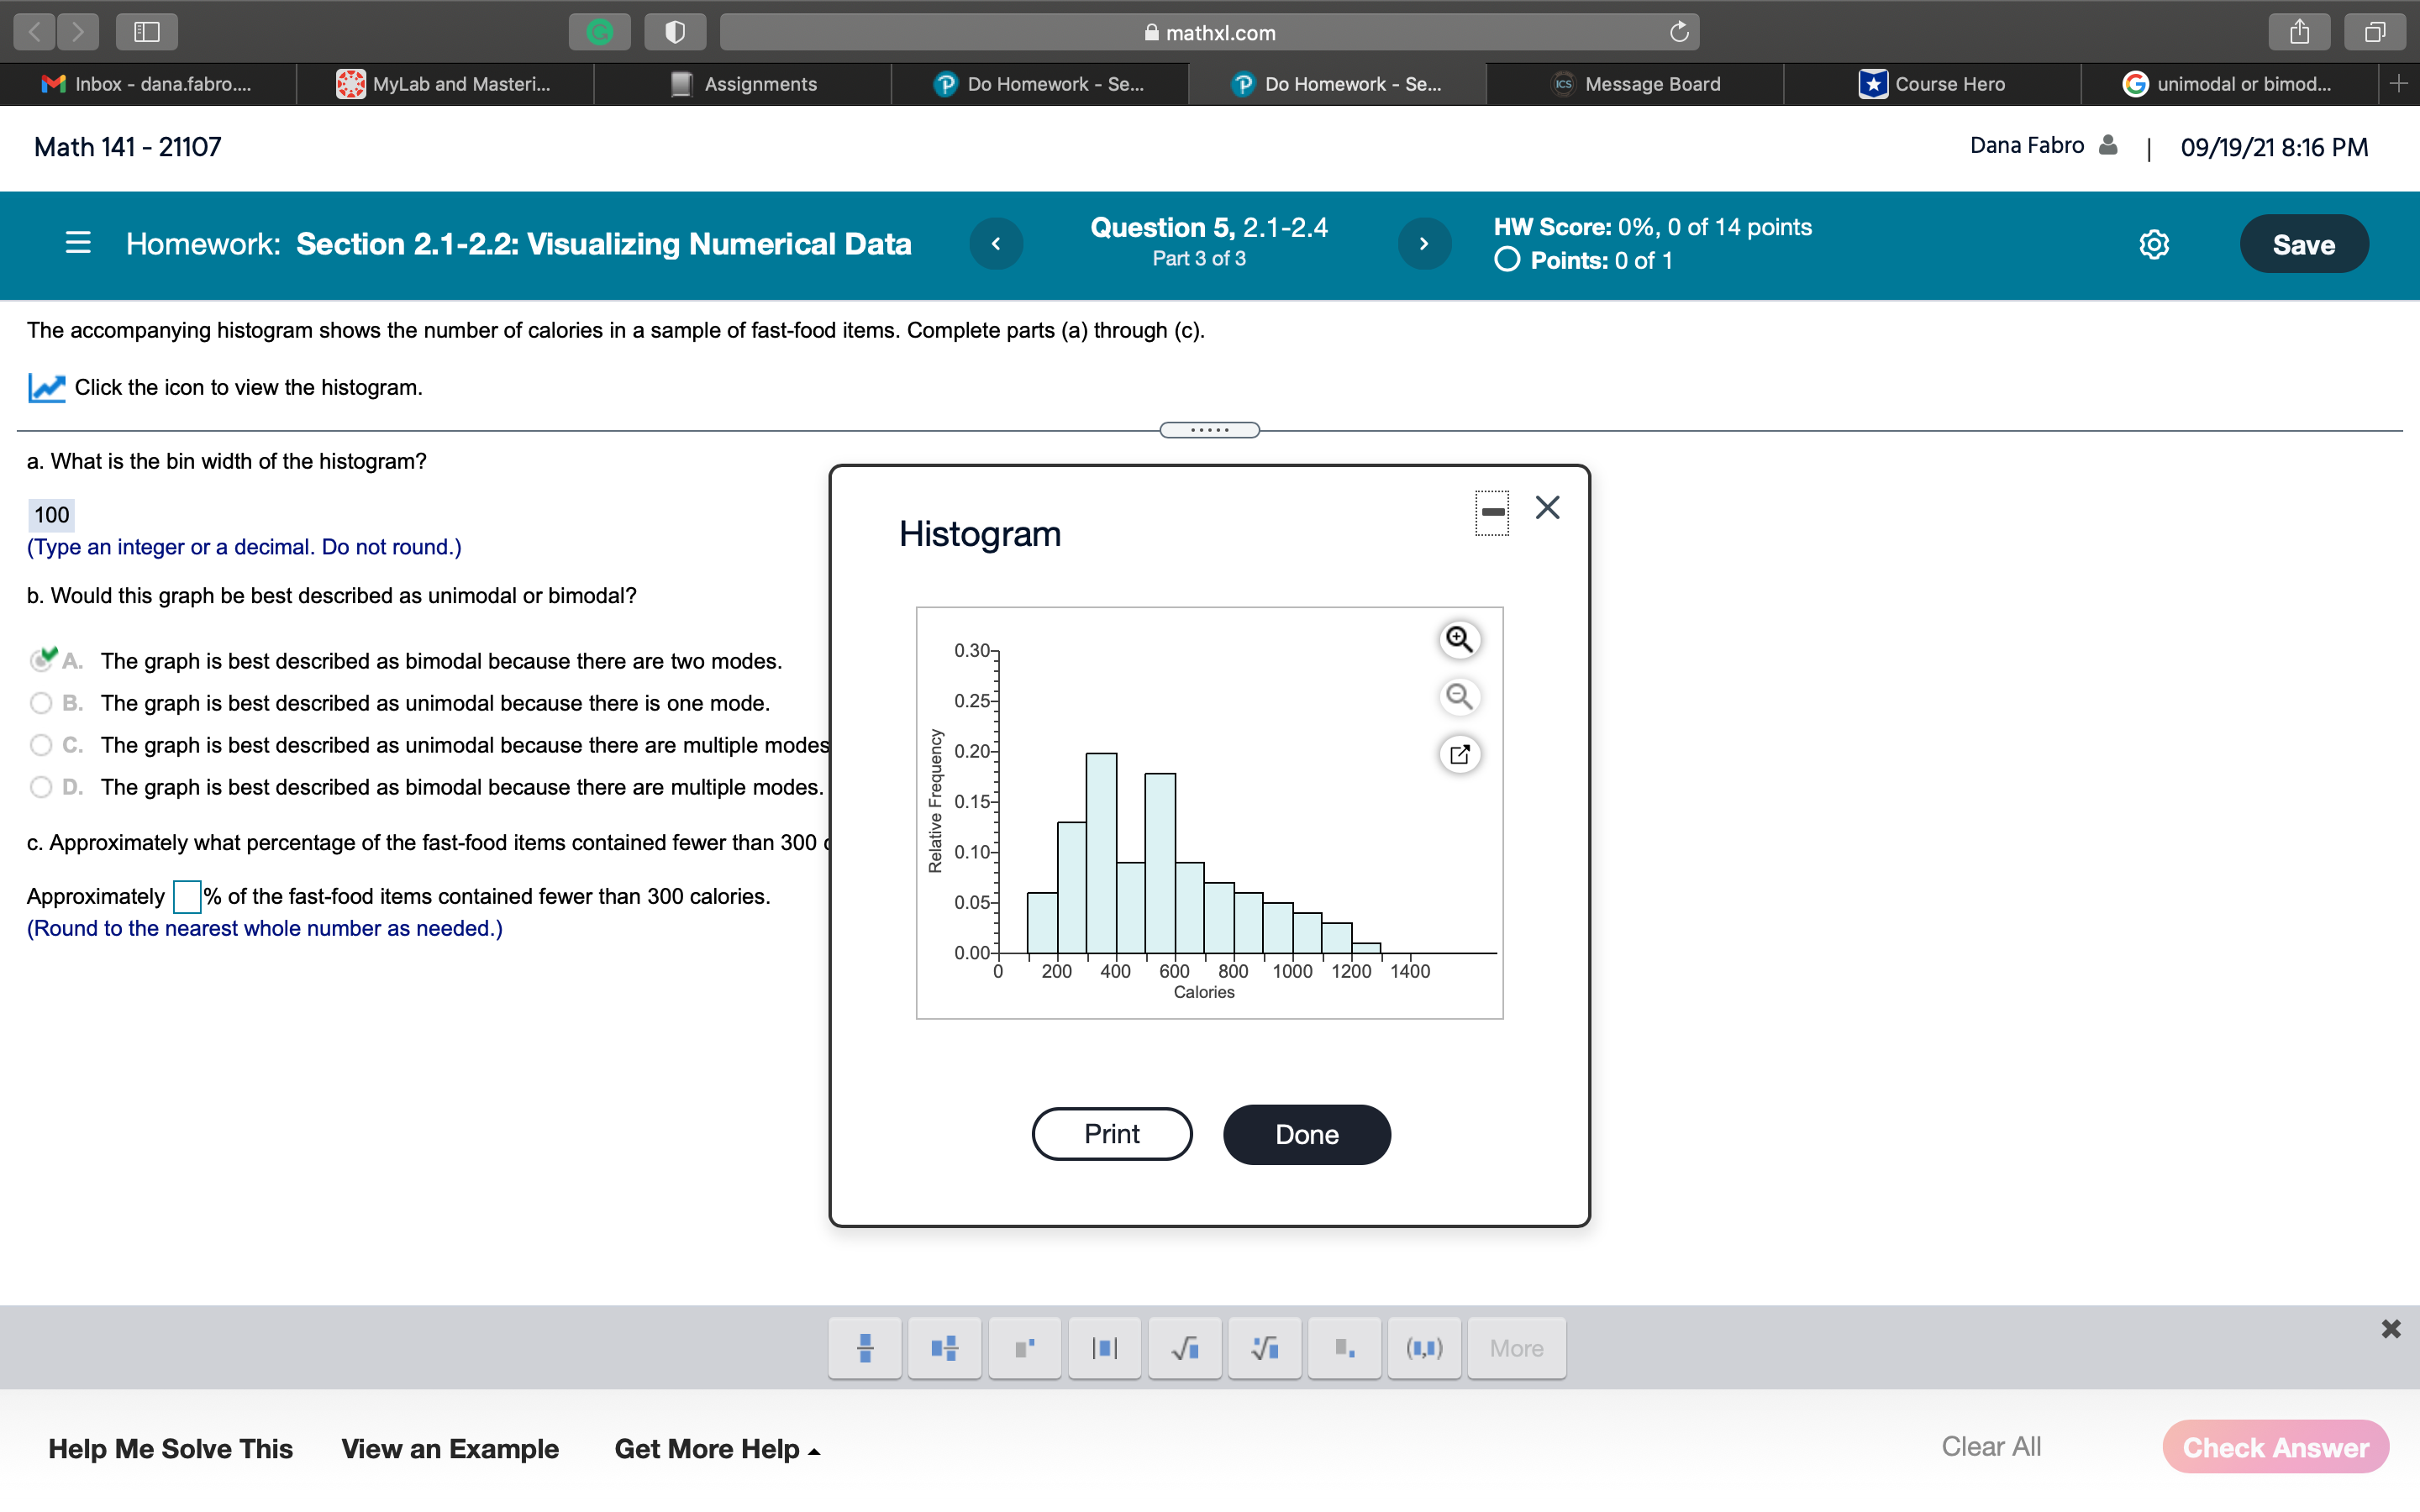
E mathxl.com 12 Do Homework , Se Math 141 - 21107 E Homework: Section 2.1-2.2: Visualizing Numerical Data Question 5, 2.1 -2.4 ) HW Score: 0%, O of 14 points Part3 cm 0 Points: 0 of 1 Dana Fabro 5 09/19/21 8:16 PM The accompanying histogram shows the number of calories in a sample of fast-food items. Complete pans (a) through (c). K Click the icon to view the histogram. a. What is the bin width of the histogram? 100 (Type an integer or a decimal, Do not round.) b. Would this graph be best described as unimodal or bimodal? .V A. The graph is best described as bimodal because there are two modes. B. The graph is best described as unimodal because there is one mode. C. The graph is best described as unimodal because there are multiple mode D. The graph is best described as bimodal because there are multiple modes. 0. Approximately what percentage of the fast-food items contained fewer than 300 4 Approximately % of the fast-food items contained fewer than 300 calories. (Round to the nearest whole number as needed.) Help Me Solve This View an Example Get More Help A Histogram Relative Frequency 0 'Ii 200 460 ' 600 300 1ooo'12'oo 14'00 Calories mweewwymwr Clear All
Step by Step Solution
There are 3 Steps involved in it

Get step-by-step solutions from verified subject matter experts