

Question: E O REGRESSION AND CORRELATION Computing the sample correlation... Kelly v V The well-known psychologist Dr. Elbod has established what he calls his Generalized Anxiety
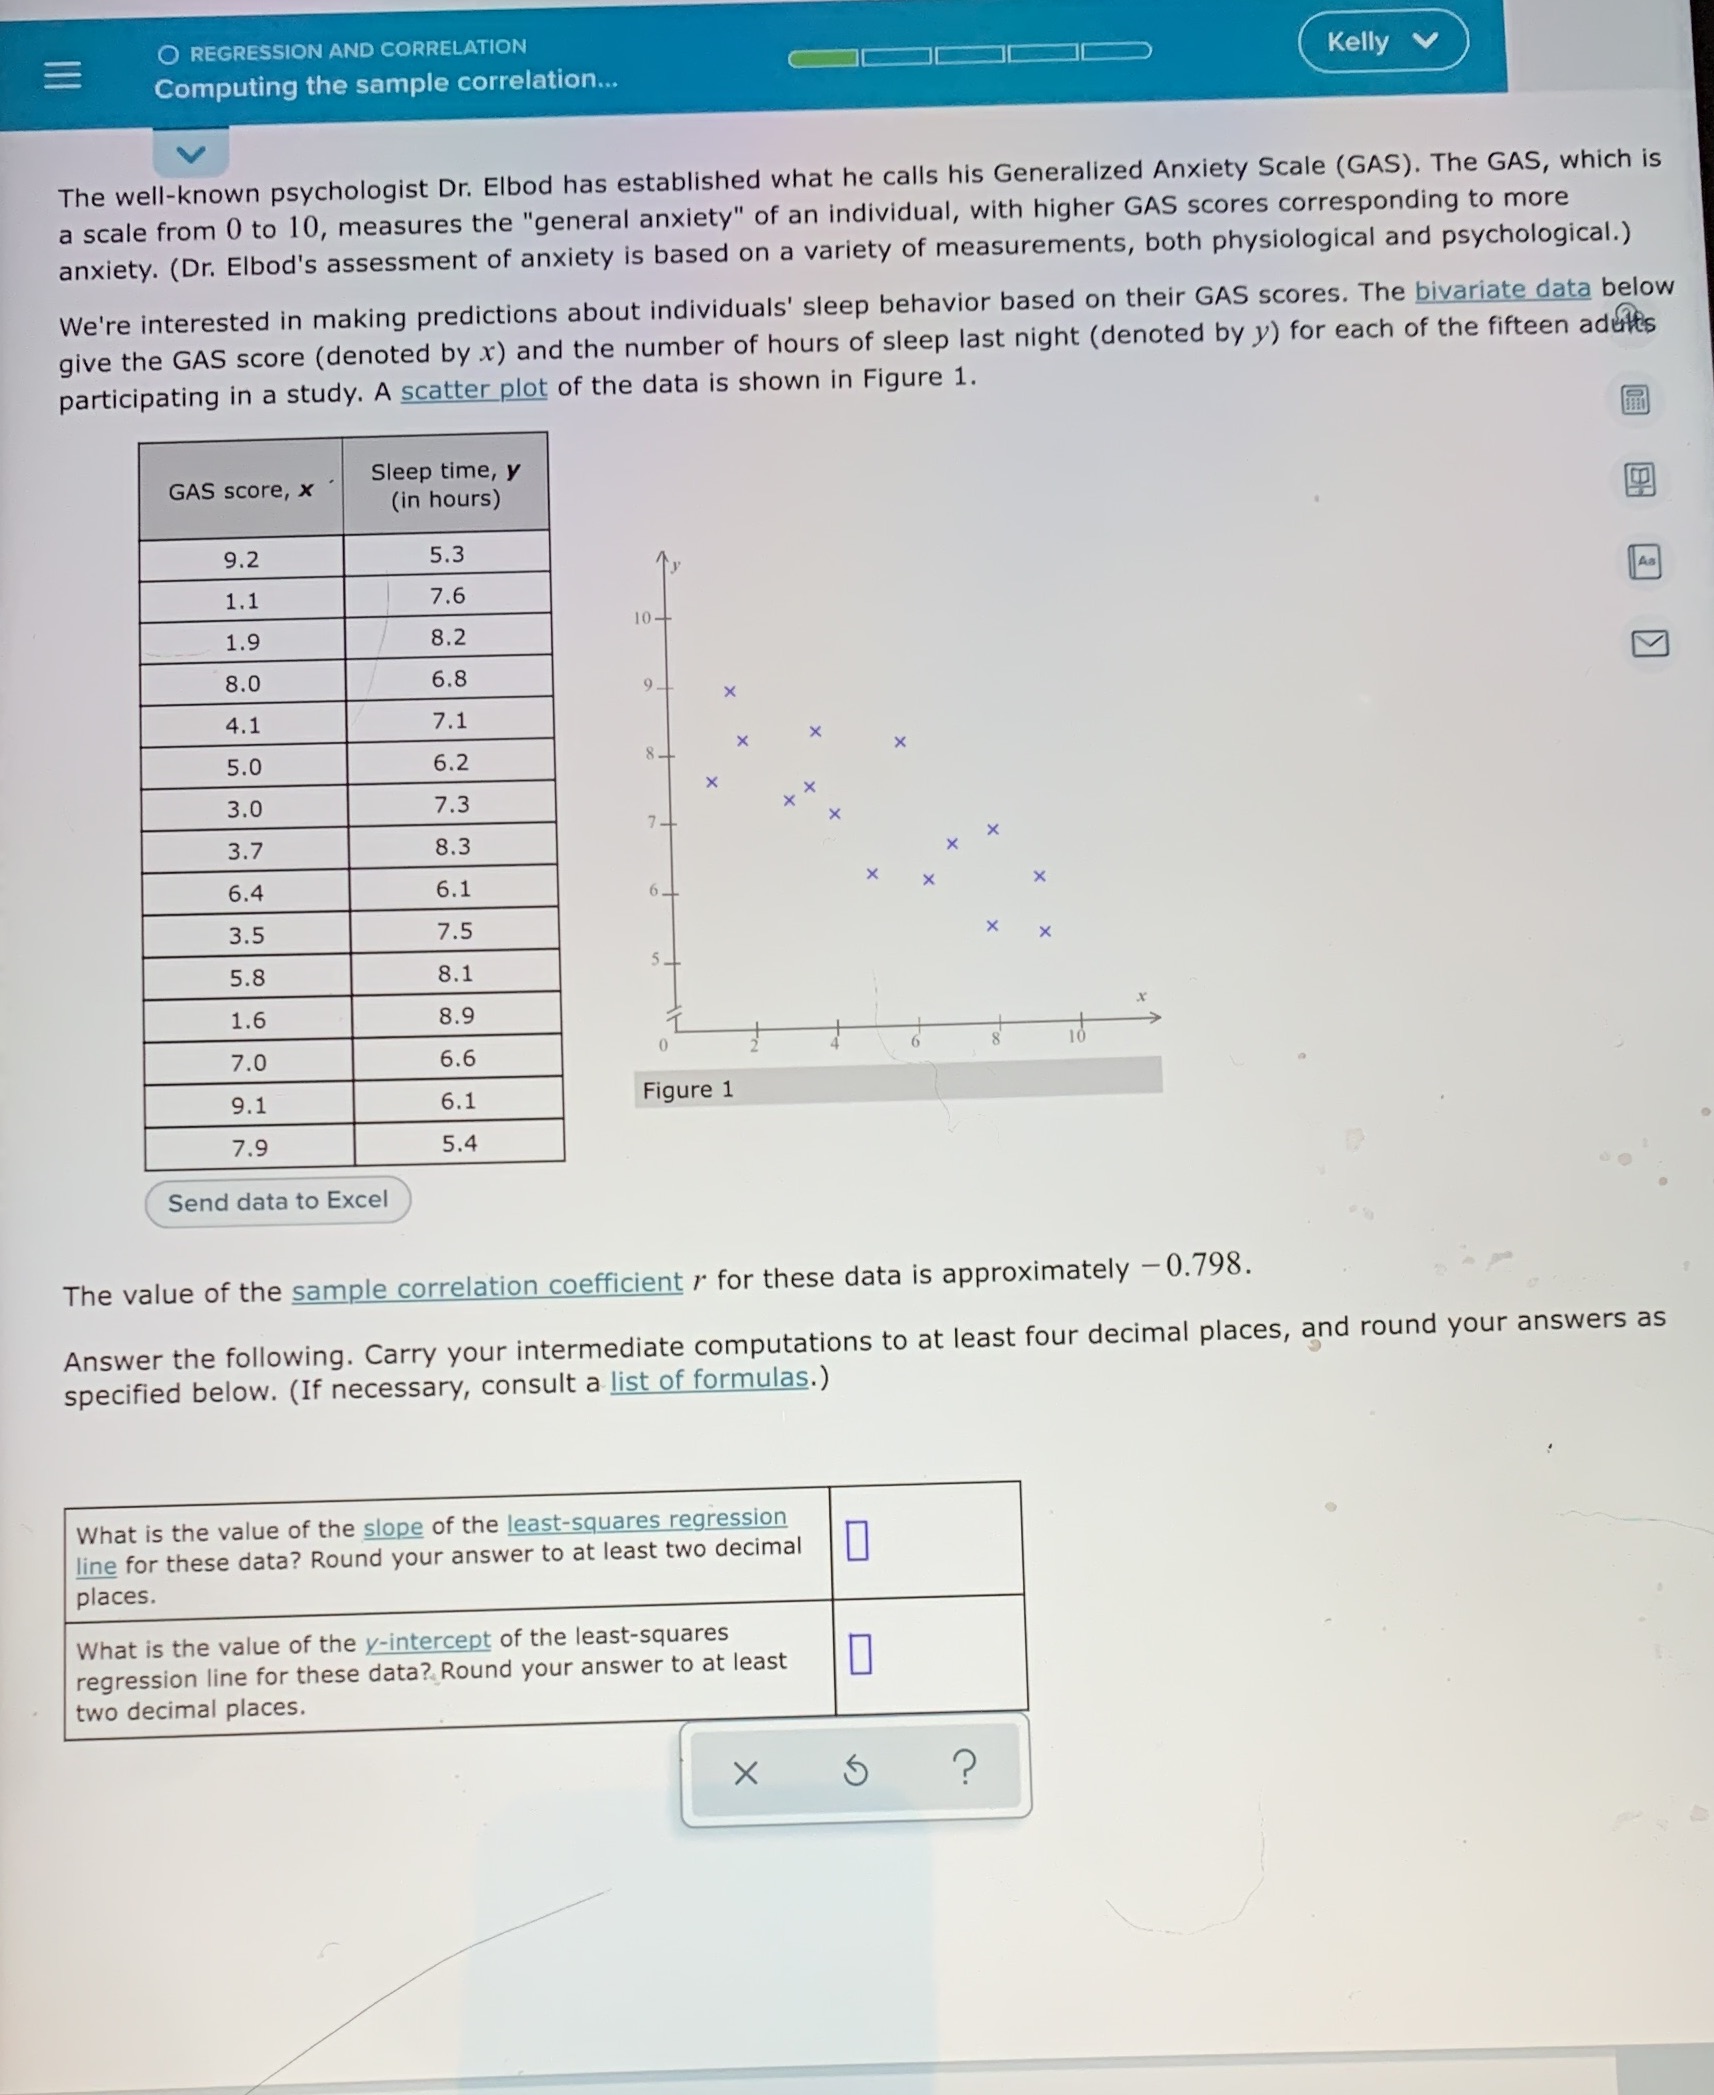
E O REGRESSION AND CORRELATION Computing the sample correlation... Kelly v V The well-known psychologist Dr. Elbod has established what he calls his Generalized Anxiety Scale (GAS). The GAS, which is a scale from 0 to 10, measures the "general anxiety" of an individual, with higher GAS scores corresponding to more anxiety. (Dr. Elbod's assessment of anxiety is based on a variety of measurements, both physiological and psychological.) We're interested in making predictions about individuals' sleep behavior based on their GAS scores. The bivariate data below give the GAS score (denoted by x) and the number of hours of sleep last night (denoted by y) for each of the fifteen adults participating in a study. A scatter plot of the data is shown in Figure 1. GAS score, x Sleep time, y (in hours) 9.2 5.3 1. 1 7.6 1.9 8.2 10- 8.0 6.8 4.1 7.1 5.0 6.2 X 3.0 7.3 X 3.7 8.3 X 5.4 X 6.1 X 3.5 7.5 5.8 X B. 1 X 1.6 8.9 7.0 6.6 6 9.1 6.1 Figure 1 7.9 5.4 Send data to Excel The value of the sample correlation coefficient / for these data is approximately - 0.798. Answer the following. Carry your intermediate computations to at least four decimal places, and round your answers as specified below. (If necessary, consult a list of formulas. ) What is the value of the slope of the least-squares regression line for these data? Round your answer to at least two decimal places. 0 What is the value of the y-intercept of the least-squares regression line for these data? Round your answer to at least two decimal places. X
Step by Step Solution
There are 3 Steps involved in it

Get step-by-step solutions from verified subject matter experts