

Question: e. Paste the StatCrunch output of your hypothesis test below. Options Paired T hypothesis test: HD = 1 - H2 : Mean of the difference
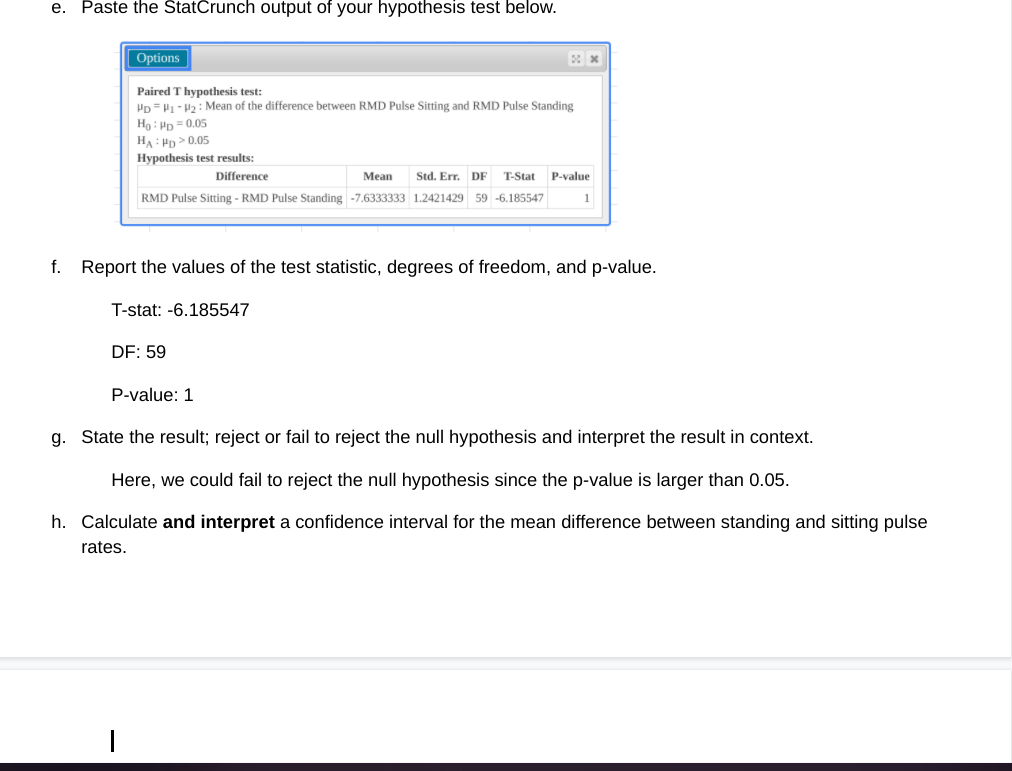
e. Paste the StatCrunch output of your hypothesis test below. Options Paired T hypothesis test: HD = 1 - H2 : Mean of the difference between RMD Pulse Sitting and RMD Pulse Standing Ho : HD = 0.05 HA : PD > 0.05 Hypothesis test results: Difference Mean Std. Err. DF T-Stat P-value RMD Pulse Sitting - RMD Pulse Standing -7.6333333 1.2421429 59 -6.185547 f. Report the values of the test statistic, degrees of freedom, and p-value. T-stat: -6.185547 DF: 59 P-value: 1 g. State the result; reject or fail to reject the null hypothesis and interpret the result in context. Here, we could fail to reject the null hypothesis since the p-value is larger than 0.05. h. Calculate and interpret a confidence interval for the mean difference between standing and sitting pulse rates.
Step by Step Solution
There are 3 Steps involved in it

Get step-by-step solutions from verified subject matter experts