

Question: e Read the Case below and answer the questions as follows: Study of enflunce of dimension of innovation on the performance of manufacturing firms in
 e
e
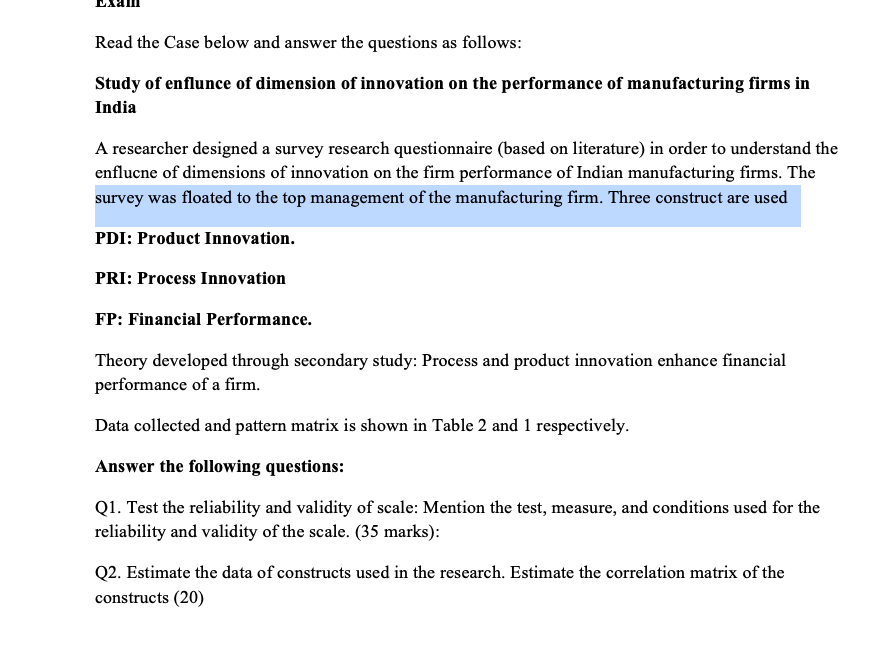
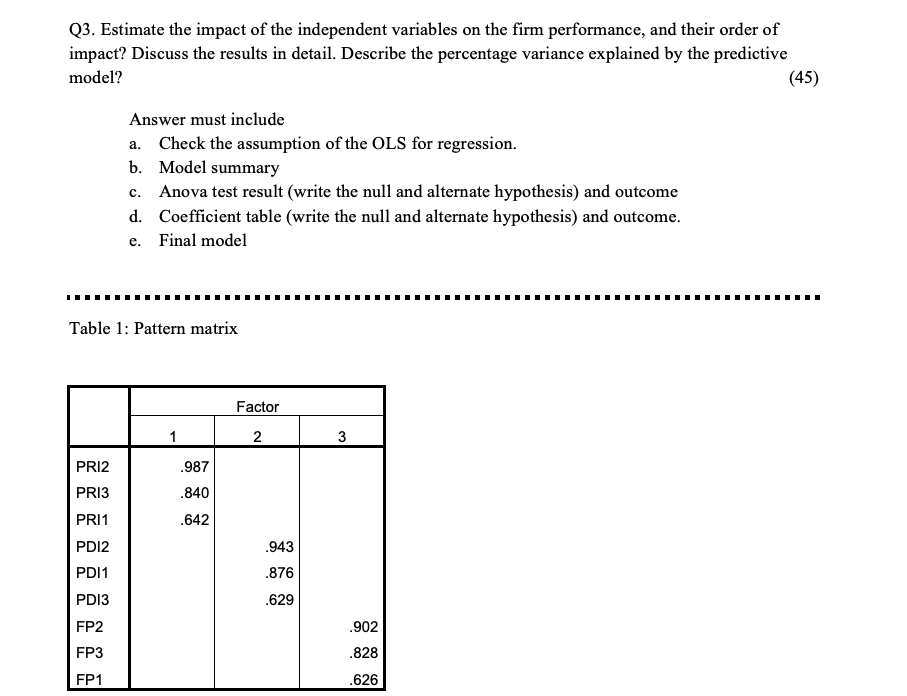
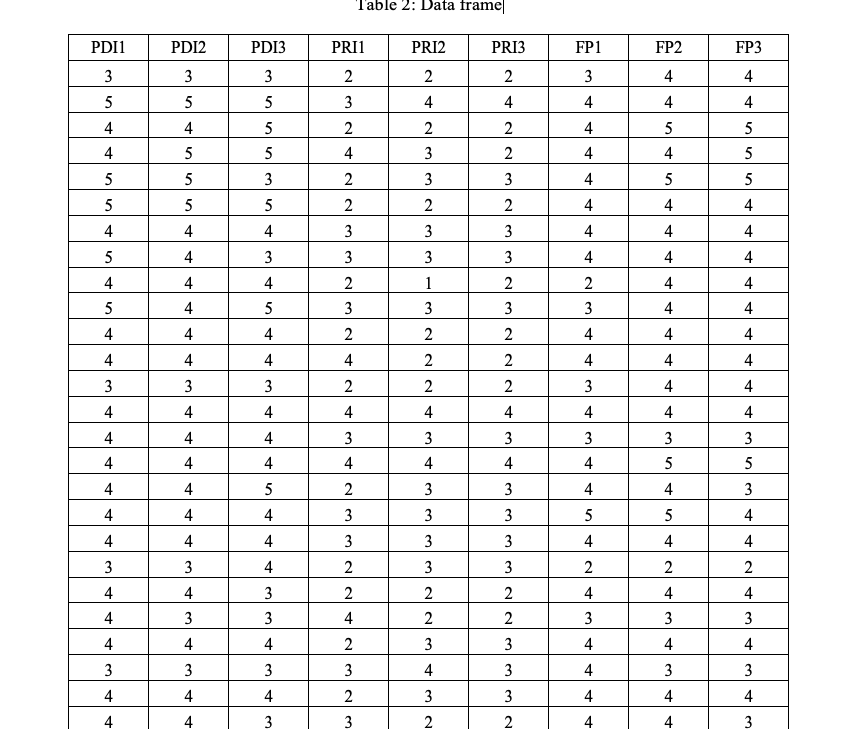
Read the Case below and answer the questions as follows: Study of enflunce of dimension of innovation on the performance of manufacturing firms in India A researcher designed a survey research questionnaire (based on literature) in order to understand the enflucne of dimensions of innovation on the firm performance of Indian manufacturing firms. The survey was floated to the top management of the manufacturing firm. Three construct are used PDI: Product Innovation. PRI: Process Innovation FP: Financial Performance. Theory developed through secondary study: Process and product innovation enhance financial performance of a firm. Data collected and pattern matrix is shown in Table 2 and 1 respectively. Answer the following questions: Q1. Test the reliability and validity of scale: Mention the test, measure, and conditions used for the reliability and validity of the scale. (35 marks): Q2. Estimate the data of constructs used in the research. Estimate the correlation matrix of the constructs (20) Q3. Estimate the impact of the independent variables on the firm performance, and their order of impact? Discuss the results in detail. Describe the percentage variance explained by the predictive model? (45) Answer must include a. Check the assumption of the OLS for regression. b. Model summary c. Anova test result (write the null and alternate hypothesis) and outcome d. Coefficient table (write the null and alternate hypothesis) and outcome. e. Final model Table 1: Pattern matrix Factor 2 3 3 PRI2 .987 .840 PRI3 PRI1 .642 PDI2 PDI1 .943 .876 PDI3 .629 FP2 .902 FP3 .828 FP1 .626 Table 2: Data frame PDI1 PDI2 PDI3 PRII PRI2 PRI3 FP1 FP2 FP3 3 2 2 3 4 4 5 3 4 4 4 4 3 5 4 5 5 5 5 5 2 4 2 2 3 2 4 2 3 4 4 4 5 5 an 4 5 3 2 3 5 5 3 5 4 4 5 5 4 5 4 5 5 5 2 2 2 2 4 4 4 5 4 4 3 3 3 3 4 4 4 3 3 4 4 4 4 IN 1 2 4 4 4 2 3 2 3 5 5 3 3 4 4 4 4 2 4 2 2 2 2 2 4 4 4 3 4 4 4 3 2 4 4 4 4 3 4 4 4 4 2 2 2 4 3 4 4 4 4 4 4 4 4 3 4 4 4 4 4 4 4 3 3 3 3 3 4 4 4 5 5 4 5 5 2 3 3 4 4 3 4 4 3 3 5 5 4 3 3 3 3 4 4 3 4 4 4 4 3 4 2 4 2 3 3 2 2 3 2 2 4 4 3 4 4 4 4 3 4 2 2 3 4 2 4 3 4 3 3 4 2 3 3 4 4 3 3 3 3 4 3 3 3 4 3 4 4 4 4 4 2 3 3 4 4 3 2 4 3 3 2 2 4 4 3 Read the Case below and answer the questions as follows: Study of enflunce of dimension of innovation on the performance of manufacturing firms in India A researcher designed a survey research questionnaire (based on literature) in order to understand the enflucne of dimensions of innovation on the firm performance of Indian manufacturing firms. The survey was floated to the top management of the manufacturing firm. Three construct are used PDI: Product Innovation. PRI: Process Innovation FP: Financial Performance. Theory developed through secondary study: Process and product innovation enhance financial performance of a firm. Data collected and pattern matrix is shown in Table 2 and 1 respectively. Answer the following questions: Q1. Test the reliability and validity of scale: Mention the test, measure, and conditions used for the reliability and validity of the scale. (35 marks): Q2. Estimate the data of constructs used in the research. Estimate the correlation matrix of the constructs (20) Q3. Estimate the impact of the independent variables on the firm performance, and their order of impact? Discuss the results in detail. Describe the percentage variance explained by the predictive model? (45) Answer must include a. Check the assumption of the OLS for regression. b. Model summary c. Anova test result (write the null and alternate hypothesis) and outcome d. Coefficient table (write the null and alternate hypothesis) and outcome. e. Final model Table 1: Pattern matrix Factor 2 3 3 PRI2 .987 .840 PRI3 PRI1 .642 PDI2 PDI1 .943 .876 PDI3 .629 FP2 .902 FP3 .828 FP1 .626 Table 2: Data frame PDI1 PDI2 PDI3 PRII PRI2 PRI3 FP1 FP2 FP3 3 2 2 3 4 4 5 3 4 4 4 4 3 5 4 5 5 5 5 5 2 4 2 2 3 2 4 2 3 4 4 4 5 5 an 4 5 3 2 3 5 5 3 5 4 4 5 5 4 5 4 5 5 5 2 2 2 2 4 4 4 5 4 4 3 3 3 3 4 4 4 3 3 4 4 4 4 IN 1 2 4 4 4 2 3 2 3 5 5 3 3 4 4 4 4 2 4 2 2 2 2 2 4 4 4 3 4 4 4 3 2 4 4 4 4 3 4 4 4 4 2 2 2 4 3 4 4 4 4 4 4 4 4 3 4 4 4 4 4 4 4 3 3 3 3 3 4 4 4 5 5 4 5 5 2 3 3 4 4 3 4 4 3 3 5 5 4 3 3 3 3 4 4 3 4 4 4 4 3 4 2 4 2 3 3 2 2 3 2 2 4 4 3 4 4 4 4 3 4 2 2 3 4 2 4 3 4 3 3 4 2 3 3 4 4 3 3 3 3 4 3 3 3 4 3 4 4 4 4 4 2 3 3 4 4 3 2 4 3 3 2 2 4 4 3
Step by Step Solution
There are 3 Steps involved in it

Get step-by-step solutions from verified subject matter experts