

Question: e. Study the graph below and describe the data illustrated in about 150 words by using vocabulary and structure as given in Pgs. 94,95,96 in
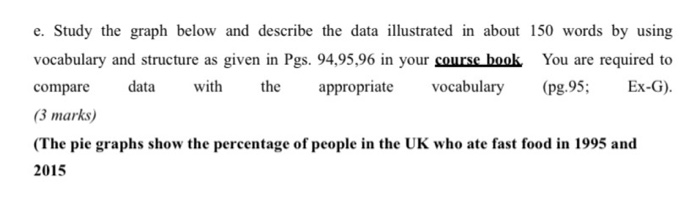
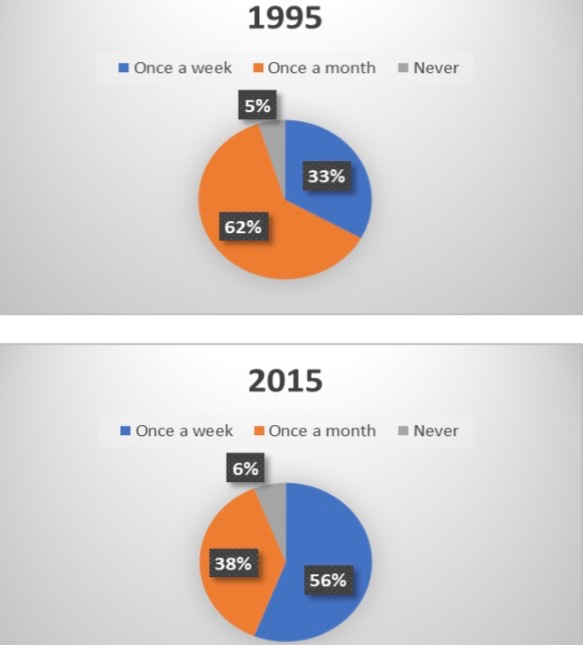
e. Study the graph below and describe the data illustrated in about 150 words by using vocabulary and structure as given in Pgs. 94,95,96 in your course book You are required to compare data with the appropriate vocabulary (pg.95; Ex-G). (3 marks) (The pie graphs show the percentage of people in the UK who ate fast food in 1995 and 2015 1995 Once a week Once a month Never 5% 33% 62% 2015 Once a week Once a month Never 6% 38% 56%
Step by Step Solution
There are 3 Steps involved in it
1 Expert Approved Answer
Step: 1 Unlock

Question Has Been Solved by an Expert!
Get step-by-step solutions from verified subject matter experts
Step: 2 Unlock
Step: 3 Unlock