

Question: E Test: Week 1 Test (1.1-1.3 This test: 100 point(s) possible College enrollment X This question: 5 point(s) possible Submit test The accompanying data represent
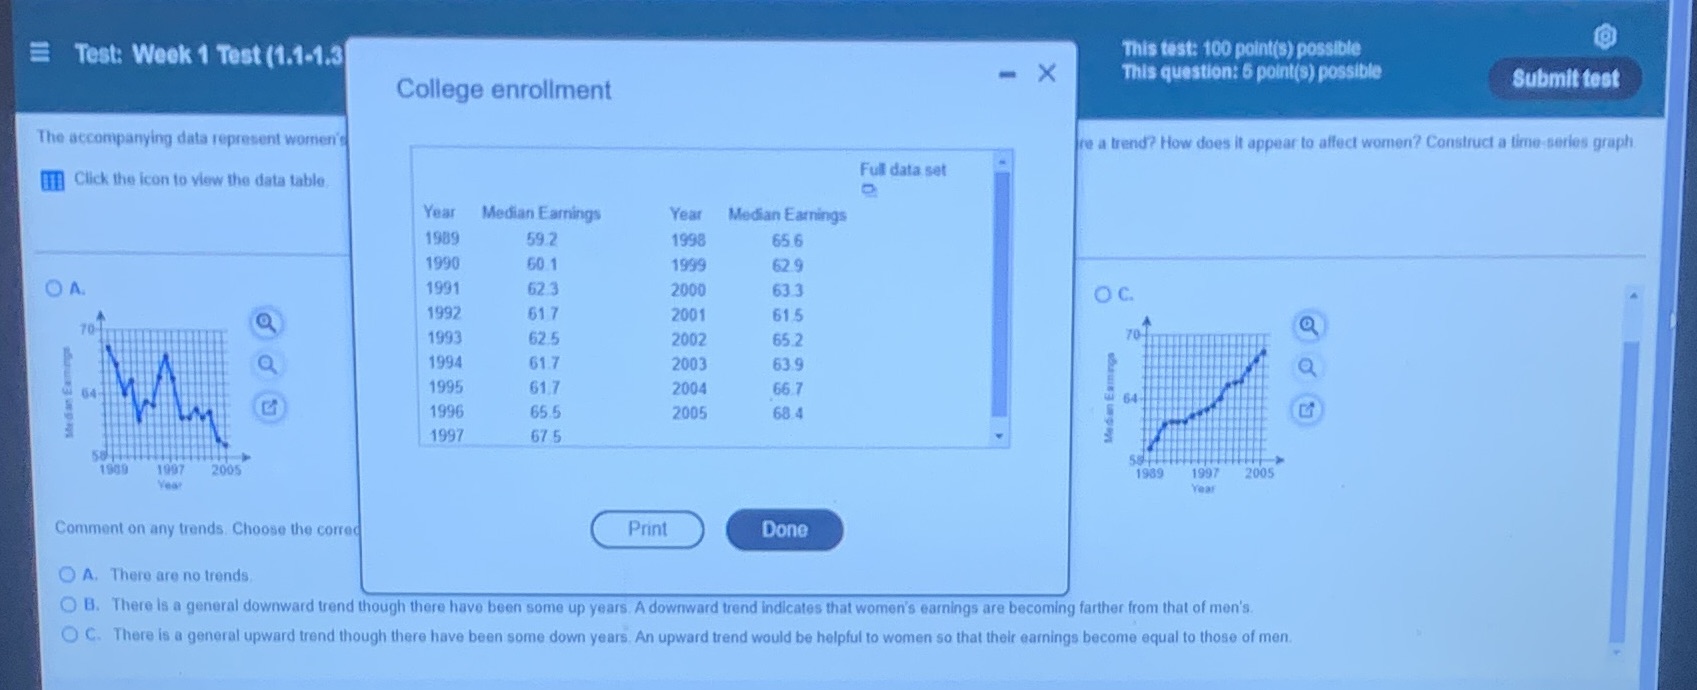
E Test: Week 1 Test (1.1-1.3 This test: 100 point(s) possible College enrollment X This question: 5 point(s) possible Submit test The accompanying data represent women's re a trend? How does it appear to affect women? Construct a time-series graph IfClick the icon to view the data table Full data set Year Median Earnings Year Median Earnings 1989 59 2 1998 65 6 1990 60 1 1999 62.9 OA. 1991 62.3 2000 63 3 O c. 1992 617 2001 615 70 1993 62.5 2002 65.2 70 1994 61.7 2003 63.9 64 1995 617 2004 66 7 Me dan Eamings 64- 1996 65.5 2005 68.4 1997 67 5 58414 1909 1097 2095 1989 1997 2005 Yea Year Comment on any trends. Choose the corred Print Done O A. There are no trends O B. There is a general downward trend though there have been some up years. A downward trend indicates that women's earnings are becoming farther from that of men's. O C. There is a general upward trend though there have been some down years. An upward trend would be helpful to women so that their earnings become equal to those of men
Step by Step Solution
There are 3 Steps involved in it

Get step-by-step solutions from verified subject matter experts