

Question: E Test: Week 9 - Test 4 - Chs. 7 - 8 - Due March 13 by 11:59 p.m. T week 9 -Test 4 -Chs.
E Test: Week 9 - Test 4 - Chs. 7 - 8 - Due March 13 by 11:59 p.m.
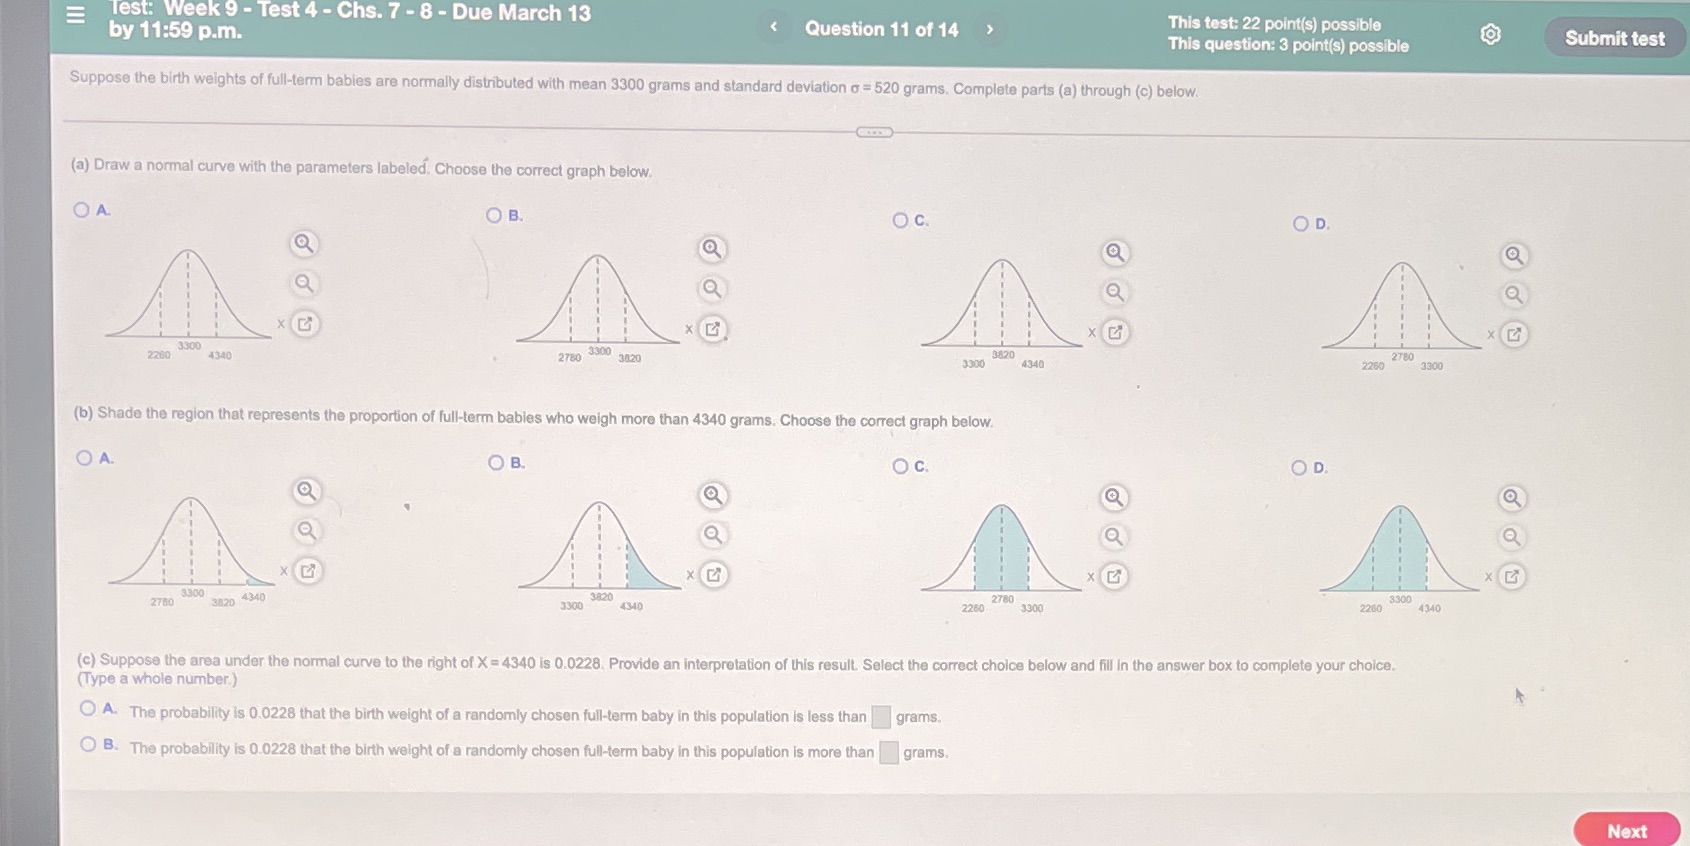
T week 9 -Test 4 -Chs. 7-8- Due March 13 est: by 11:59 p.m. Question 11 of 14 This test: 22 point(s) possible This question: 3 point(s) possible Suppose the birth weights of fun-term babies are normal'y distributed with mean 3300 grams and standard deviation = 520 grams. Complete parts (a) through (c) betow (a) Draw a normal curve with the parameters labeled Choose the correct graph beto.v (b) Shade the region that represents the proportion of lull-term babies who weigh more than 4340 grams. Choose the correct graph below (c) Suppose the area under the normal curve to the right of X = 4340 is 0 0228 Provide an interpretation or Ihis result Select the correct choice below and fill in tho answer box to complete your choice. (Type a whole number ) O The probability is 0 0228 that the birth weight of a randomly chosen full-term baby in this population is less than grams. O B The probability is 0 0228 that the birth weight ofa randomly chosen fun-term baby in this population is more than grams: Submit test Next
Step by Step Solution
There are 3 Steps involved in it

Get step-by-step solutions from verified subject matter experts