

Question: E. Use the following table to answer questions 1 & 2 (6 pts) Table I Attitude to Social class birth control Lower Middle Upper All
E. Use the following table to answer questions 1 & 2 (6 pts)
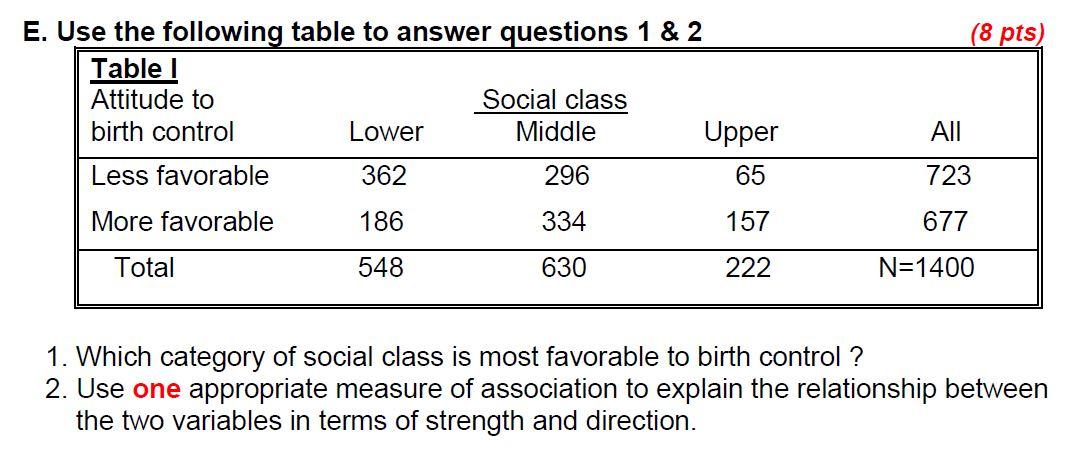
Table I
Attitude to Social class
birth control Lower Middle Upper All
Less favorable 362 296 65 723
More favorable 186 334 157 677
Total 548 630 222 N=1400
1. Which category of social class is most favorable to birth control ?
2. Use one appropriate measure of association to explain the relationship between
the two variables in terms of strength and direction.
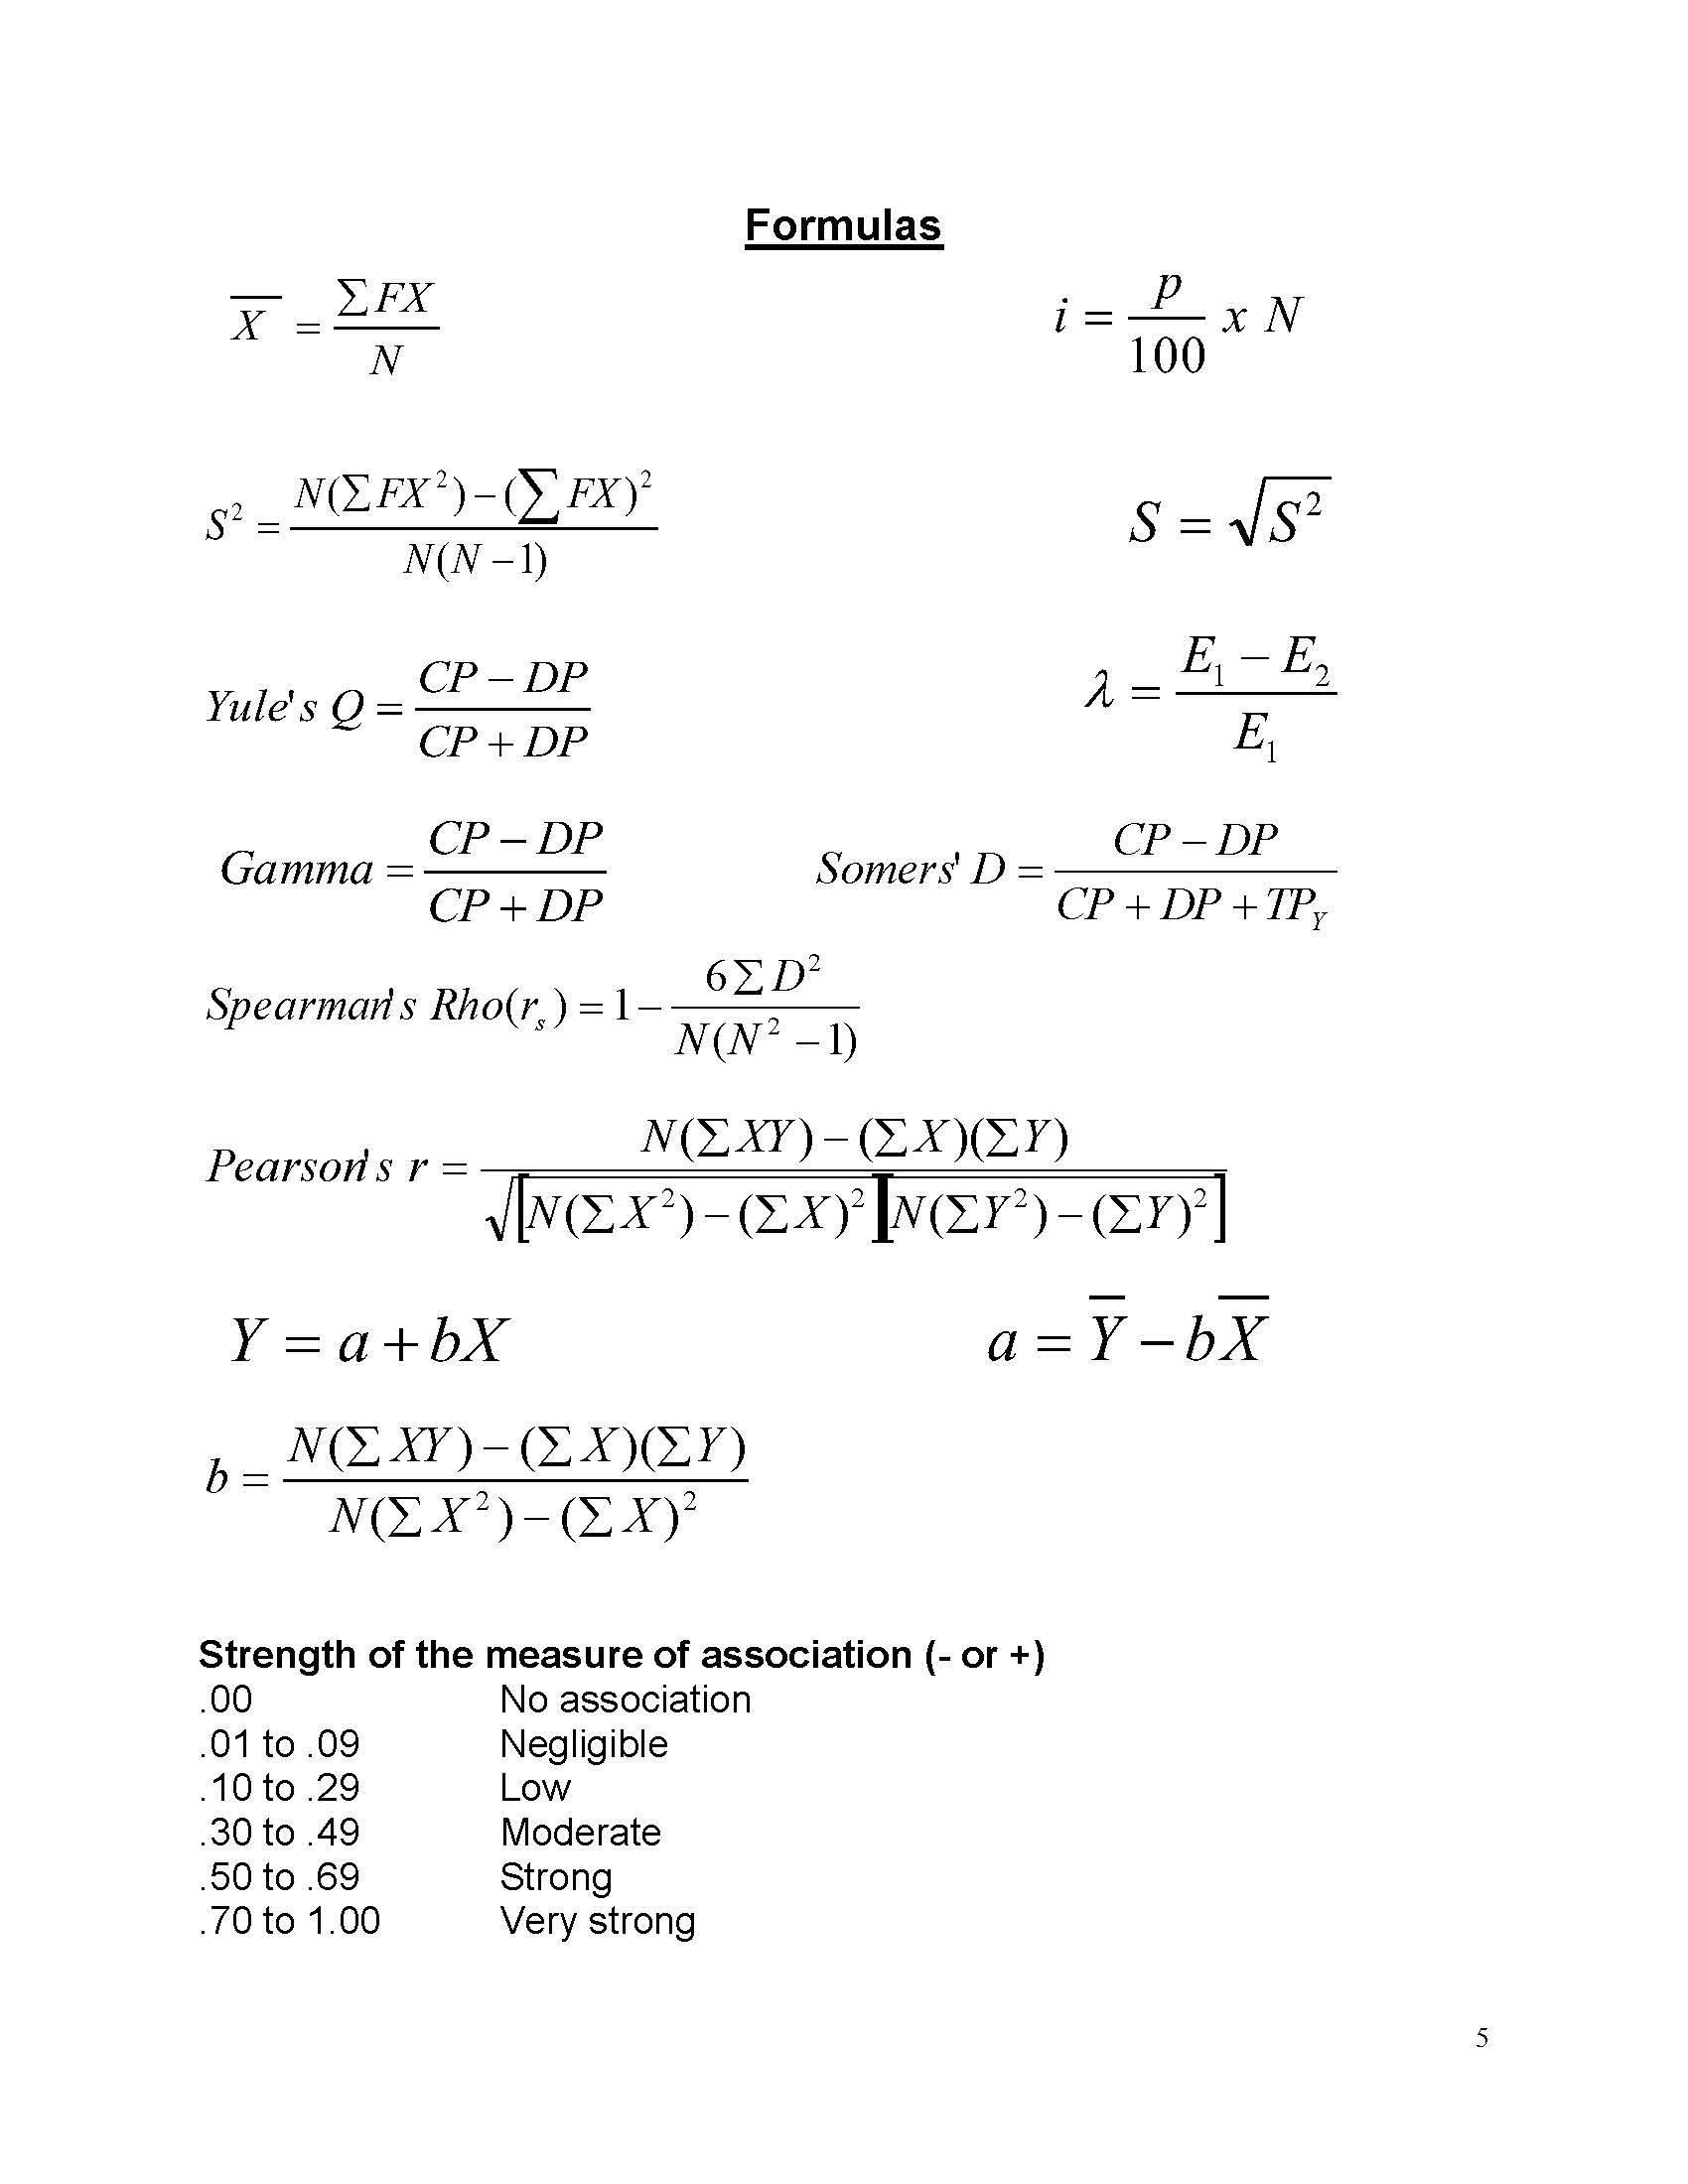
E. Use the following table to answer questions 1 & 2 (8 pts) Table I Attitude to Social class birth control Lower Middle Upper All Less favorable 362 296 65 723 More favorable 186 334 157 677 Total 548 630 222 N=1400 1. Which category of social class is most favorable to birth control ? 2. Use one appropriate measure of association to explain the relationship between the two variables in terms of strength and direction.Formulas X _ EFX i = P x N N 100 $2 _N(EFX?) -( FX ) S = VS2 N(N -1) CP - DP E - E2 Yule's Q = - 1 = CP + DP E CP - DP CP - DP Gamma =- Somers' D = CP + DP CP + DP + TP 6ED Spearman's Rho(r, ) = 1-. N(N2 - 1) Pearson s r = N(EXY ) -(EX) (EY) Y = a+bX a =Y-bx b- N(EXY ) -(EX)(EY) N(EX? ) -(EX)2 Strength of the measure of association (- or +) 00 No association 01 to .09 Negligible 10 to .29 Low 30 to .49 Moderate .50 to .69 Strong 70 to 1.00 Very strong 5
Step by Step Solution
There are 3 Steps involved in it

Get step-by-step solutions from verified subject matter experts