

Question: e. What is the current ratio for the two years? How does it compare to the Moodys 2019 Median of 1.9? Perform research and provide
e. What is the current ratio for the two years? How does it compare to the Moodys 2019 Median of 1.9? Perform research and provide the formulas required to calculate ratios for item (4 ratios total).
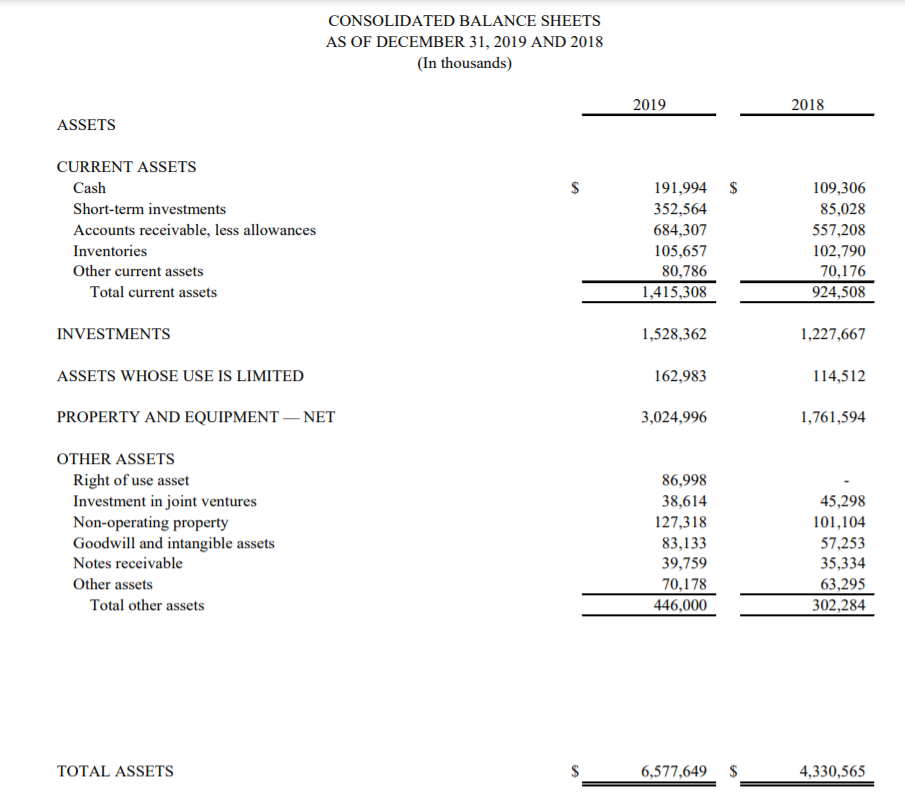
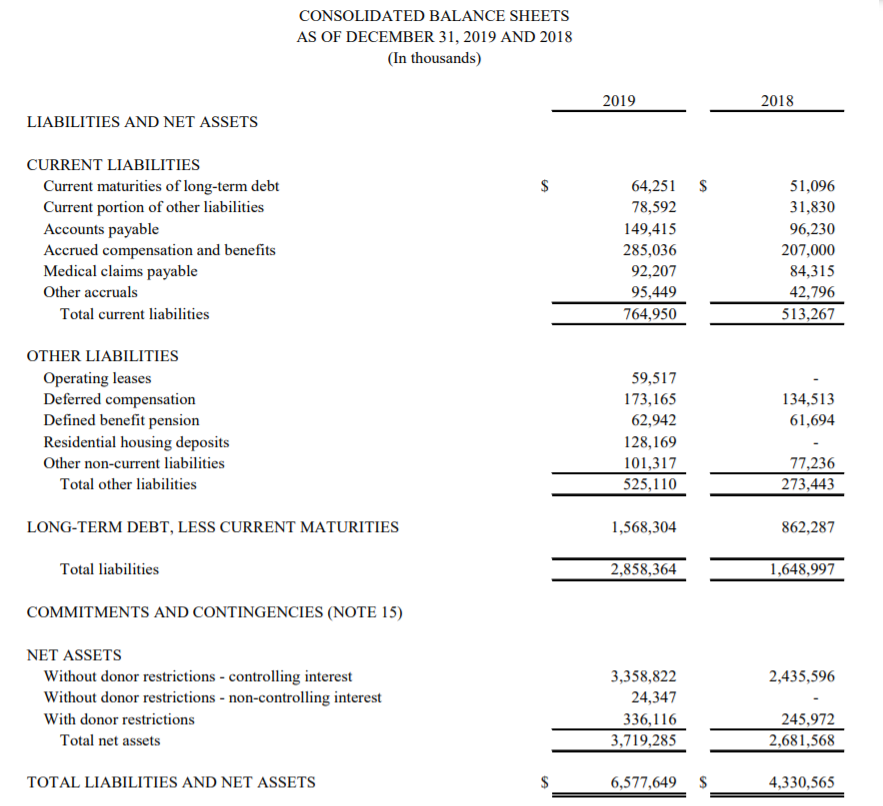
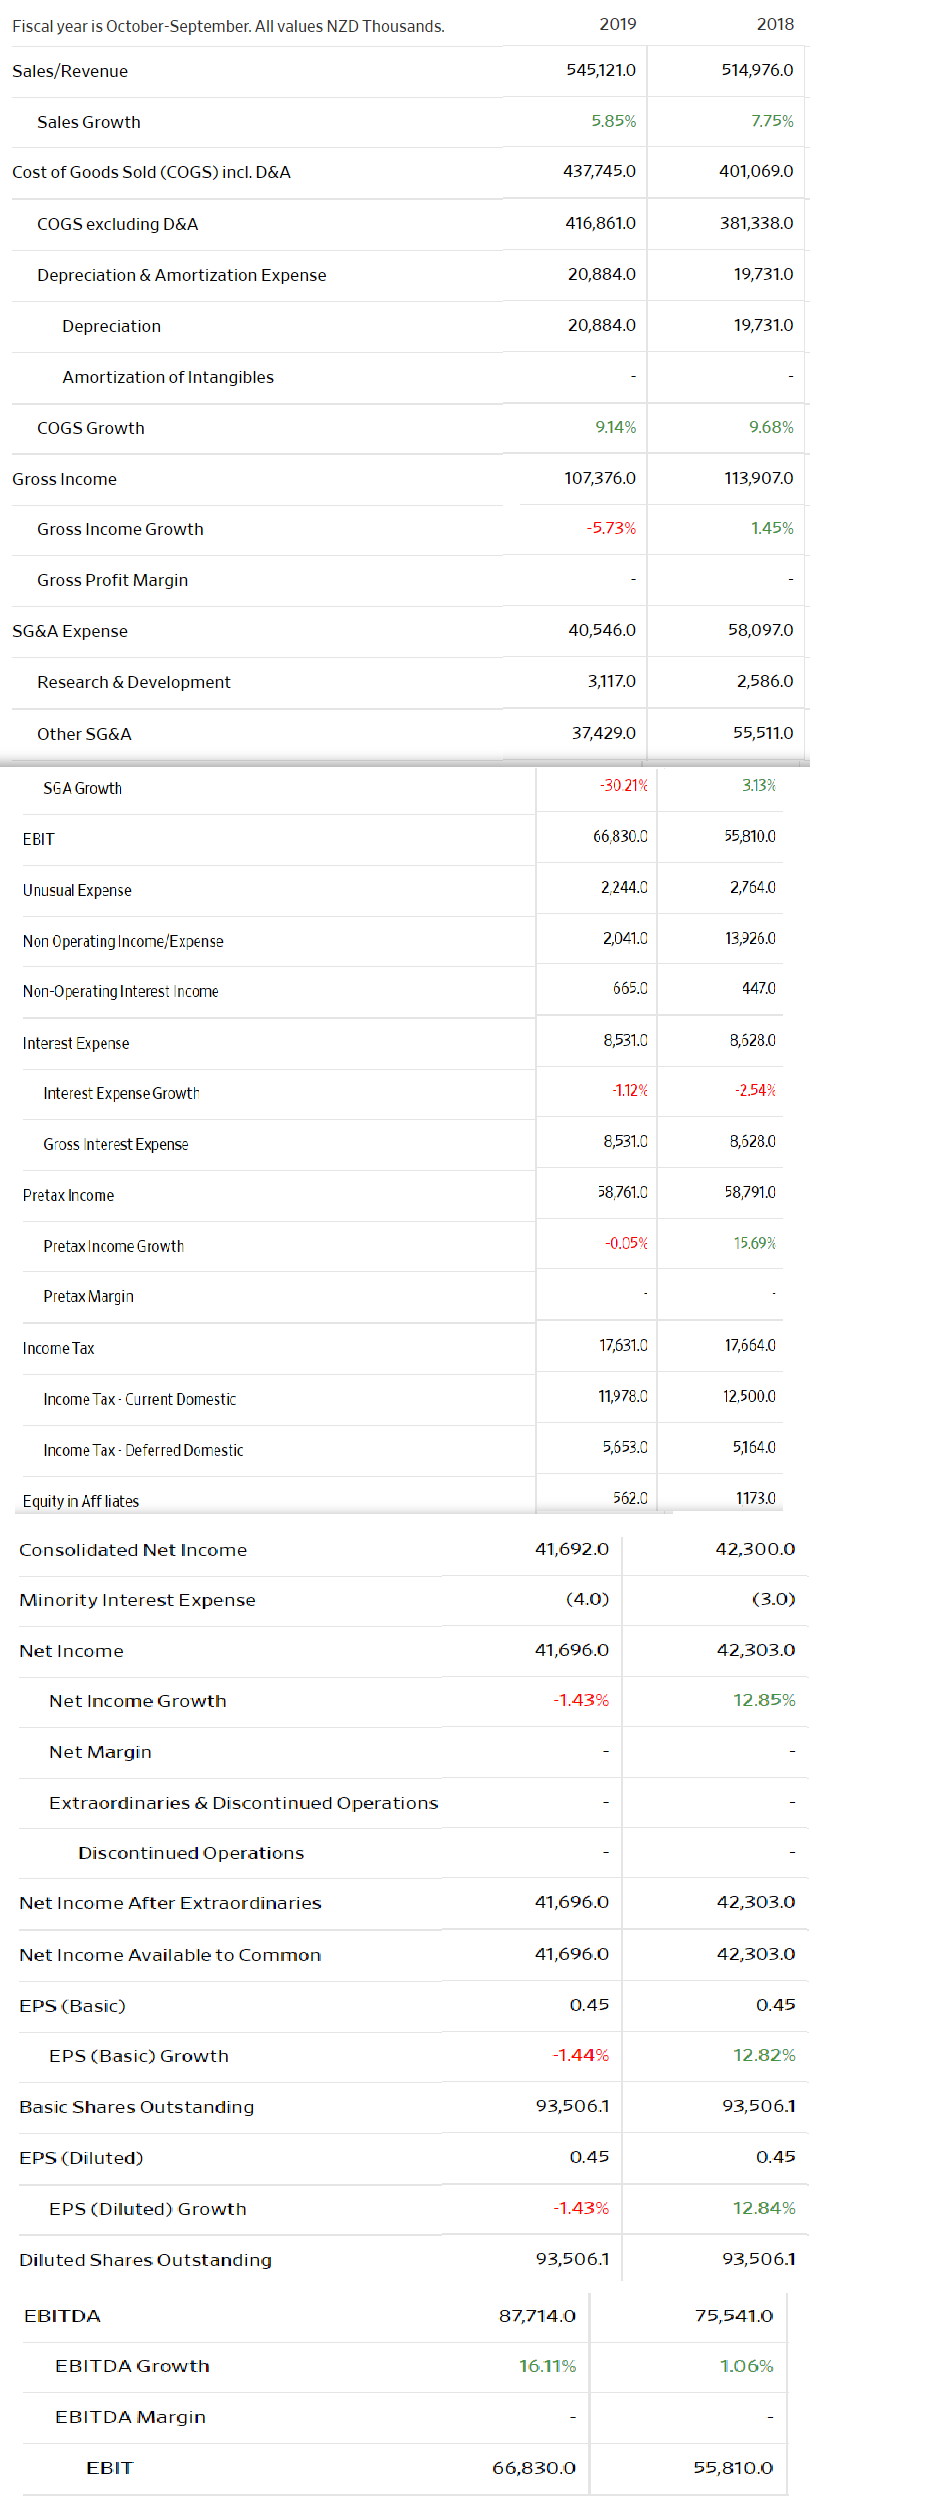
CONSOLIDATED BALANCE SHEETS AS OF DECEMBER 31, 2019 AND 2018 (In thousands) 2019 2018 ASSETS $ CURRENT ASSETS Cash Short-term investments Accounts receivable, less allowances Inventories Other current assets Total current assets 191,994 $ 352,564 684,307 105,657 80,786 1,415,308 109,306 85,028 557,208 102,790 70,176 924,508 INVESTMENTS 1,528,362 1,227,667 ASSETS WHOSE USE IS LIMITED 162,983 114,512 PROPERTY AND EQUIPMENT - NET 3,024,996 1,761,594 OTHER ASSETS Right of use asset Investment in joint ventures Non-operating property Goodwill and intangible assets Notes receivable Other assets Total other assets 86,998 38,614 127,318 83,133 39,759 70,178 446,000 45,298 101,104 57,253 35,334 63,295 302,284 TOTAL ASSETS A 6,577,649 $ 4,330,565 CONSOLIDATED BALANCE SHEETS AS OF DECEMBER 31, 2019 AND 2018 (In thousands) 2019 2018 LIABILITIES AND NET ASSETS $ CURRENT LIABILITIES Current maturities of long-term debt Current portion of other liabilities Accounts payable Accrued compensation and benefits Medical claims payable Other accruals Total current liabilities 64,251 $ 78,592 149,415 285,036 92,207 95,449 764,950 51,096 31,830 96,230 207,000 84,315 42,796 513,267 OTHER LIABILITIES Operating leases Deferred compensation Defined benefit pension Residential housing deposits Other non-current liabilities Total other liabilities 134,513 61,694 59,517 173,165 62,942 128,169 101,317 525,110 77,236 273,443 LONG-TERM DEBT, LESS CURRENT MATURITIES 1,568,304 862,287 Total liabilities 2,858,364 1,648,997 COMMITMENTS AND CONTINGENCIES (NOTE 15) 2,435,596 NET ASSETS Without donor restrictions - controlling interest Without donor restrictions - non-controlling interest With donor restrictions Total net assets 3,358,822 24,347 336,116 3,719,285 245,972 2,681,568 TOTAL LIABILITIES AND NET ASSETS $ 6,577,649 S 4,330,565 Fiscal year is October September. All values NZD Thousands. 2019 2018 Sales/Revenue 545,121.0 514,976.0 Sales Growth 5.85% 7.75% Cost of Goods Sold (COGS) incl. D&A 437,745.0 401,069.0 COGS excluding D&A 416,861.0 381,338.0 Depreciation & Amortization Expense 20,884.0 19,731.0 Depreciation 20,884.0 19,731.0 Amortization of Intangibles COGS Growth 9.14% 9.68% Gross Income 107,376.0 113,907.0 Gross Income Growth -5.73% 1.45% Gross Profit Margin SG&A Expense 40,546.0 58,097.0 Research & Development 3,117.0 2,586.0 Other SG&A 37,429.0 55,511.0 SGA Growth -30.21% 3.13% EBIT 66,830.0 55,810.0 Unusual Expense 2,244.0 2,764.0 Non Operating Income/Expense 2,041.0 13,926.0 Non-Operating Interest Income 665.0 447.0 Interest Expense 8,531.0 8,628.0 Interest Expense Growth -1.12% -2.54% Gross Interest Expense 8,531.0 8,628.0 Pretax Income 58,761.0 58,791.0 Pretax Income Growth -0.05% 15.69% Pretax Margin Income Tax 17,631.0 17,664.0 Income Tax - Current Domestic 11,978.0 12,500.0 Income Tax-Deferred Domestic 5,653.0 5164.0 Equity in Affliates 562.0 1173.0 Consolidated Net Income 41,692.0 42,300.0 Minority Interest Expense (4.0) (3.0) Net Income 41,696.0 42,303.0 Net Income Growth -1.43% 12.85% Net Margin Extraordinaries & Discontinued Operations Discontinued Operations Net Income After Extraordinaries 41,696.0 42,303.0 Net Income Available to Common 41,696.0 42,303.0 EPS (Basic) 0.45 0.45 EPS (Basic) Growth -1.44% 12.82% Basic Shares Outstanding 93,506.1 93,506.1 EPS (Diluted) 0.45 0.45 EPS (Diluted) Growth -1.43% 12.84% Diluted Shares Outstanding 93,506.1 93,506.1 EBITDA 87,714.0 75,541.0 EBITDA Growth 16.11% 1.06% EBITDA Margin EBIT 66,830.0 55,810.0
Step by Step Solution
There are 3 Steps involved in it

Get step-by-step solutions from verified subject matter experts