

Question: E14-13A E14-15A E14-16A E14-17A E14-21A 14-13A Horizontal analysis (Learning Objective 1) 102,000 Prepare a horizontal analysis of the following comparative income statement of Group. The
 E14-13A
  E14-15A
  E14-16A
  E14-17A
  E14-21A
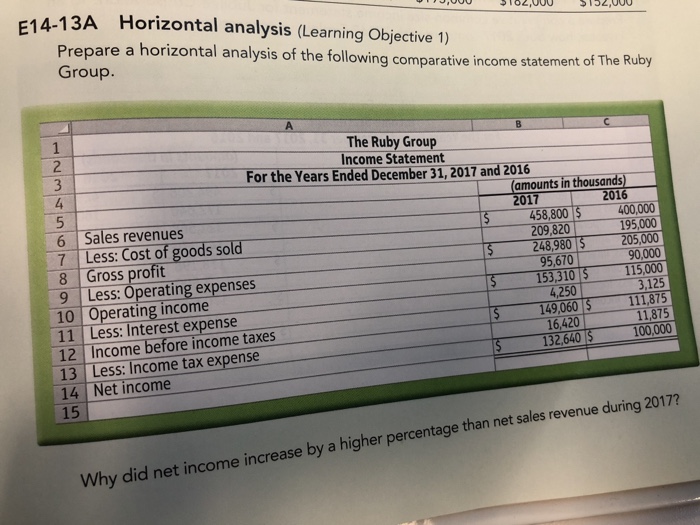
 14-13A Horizontal analysis (Learning Objective 1) 102,000 Prepare a horizontal analysis of the following comparative income statement of Group. The Ruby The Ruby Group Income Statement For the Years Ended December 31, 2017 and 2016 2 4 6 Sales revenues (amounts in thousands) 2017 2016 400,000 195,000 248,980 5 205,000 90,000 115,000 7 Less: Cost of goods sold 458,800 209,820 8 Gross profit 9 Less: Operating expenses 10 Operating income 11 Less: Interest expense 12 Income before income taxes 95,670 153310 5125 4,250 111,875 16,420 132,640 100,000 13 Less: Income tax expense 14 Net income 15 ue during 2017? y did net income increase by a higher percentage than net sales reven
Step by Step Solution
There are 3 Steps involved in it

Get step-by-step solutions from verified subject matter experts