

Question: E17-13 Performing horizontal analysis-income statement Data for Mulberry Designs, Inc. follow: MULBERRY DESIGNS, INC. Comparative Income Statement Years Ended December 31, 2018 and 2017 2018
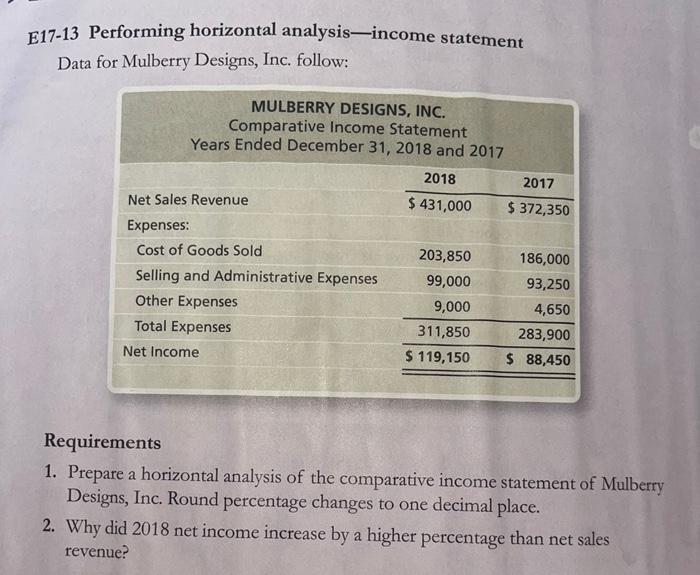
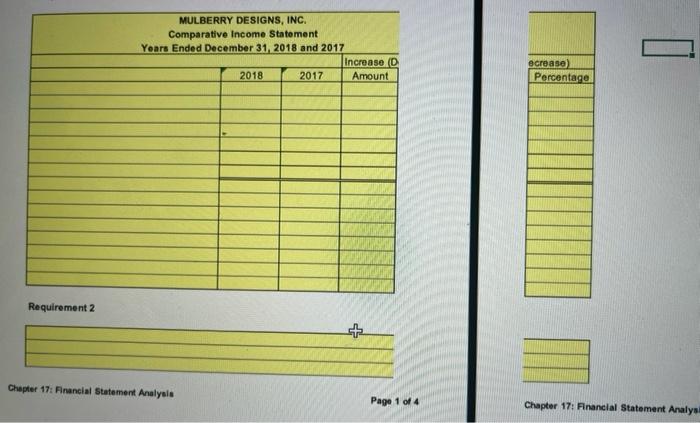
E17-13 Performing horizontal analysis-income statement Data for Mulberry Designs, Inc. follow: MULBERRY DESIGNS, INC. Comparative Income Statement Years Ended December 31, 2018 and 2017 2018 2017 $ 431,000 $ 372,350 Net Sales Revenue Expenses: Cost of Goods Sold Selling and Administrative Expenses Other Expenses Total Expenses Net Income 203,850 99,000 9,000 311,850 $ 119,150 186,000 93,250 4,650 283,900 $ 88,450 Requirements 1. Prepare a horizontal analysis of the comparative income statement of Mulberry Designs, Inc. Round percentage changes to one decimal place. 2. Why did 2018 net income increase by a higher percentage than net sales revenue? MULBERRY DESIGNS, INC. Comparative Income Statement Years Ended December 31, 2018 and 2017 Increase D 2018 2017 Amount ecrease) Percentage Requirement 2 + Chapter 17: Financial Statement Analysis Page 1 of 4 Chapter 17: Financial Statement Analys
Step by Step Solution
There are 3 Steps involved in it

Get step-by-step solutions from verified subject matter experts