

Question: E18-16 below. Selected comparative financial data (in thousands, except for share price) for Cineplex Inc. are shown Calcu (LO4 2014 2013 Revenue $1,234,716 $1,171,267 Interest
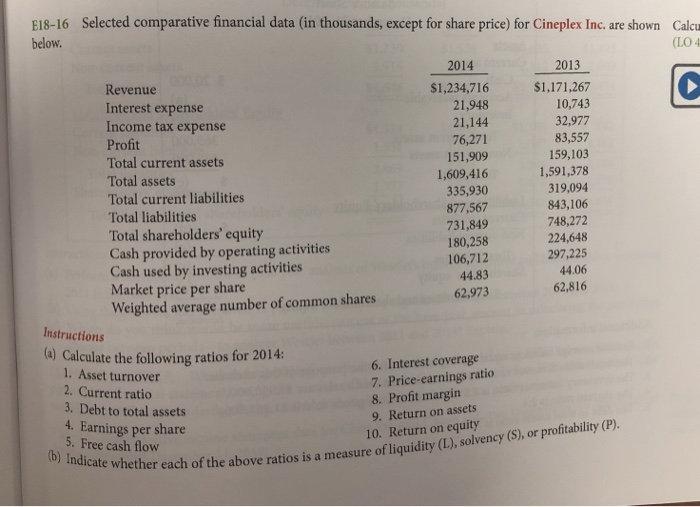
E18-16 below. Selected comparative financial data (in thousands, except for share price) for Cineplex Inc. are shown Calcu (LO4 2014 2013 Revenue $1,234,716 $1,171,267 Interest expense 21,948 10,743 Income tax expense 21,144 32,977 Profit 76,271 83,557 159,103 Total current assets 151,909 Total assets 1,609,416 1,591,378 335,930 319,094 Total current liabilities 877,567 843,106 Total liabilities 731,849 748,272 Total shareholders' equity 180,258 224,648 Cash provided by operating activities 106,712 297,225 Cash used by investing activities 44.83 44.06 Market price per share 62,973 62,816 Weighted average number of common shares Instructions (a) Calculate the following ratios for 2014: 1. Asset turnover 2. Current ratio 3. Debt to total assets 4. Earnings per share 5. Free cash flow (b) Indicate whether each oft 6. Interest coverage 7. Price earnings ratio 8. Profit margin 9. Return on assets 10. Return on equity her each of the above ratios is a measure of liquidity (L), solvency (5), or prontam
Step by Step Solution
There are 3 Steps involved in it

Get step-by-step solutions from verified subject matter experts