

Question: E4-26. Module 4 | Credit Risk Analysis and Interpe Compute and Interpret Liquidity, Solvency, and Coverage Ratios Selected balance sheet and income statement information for
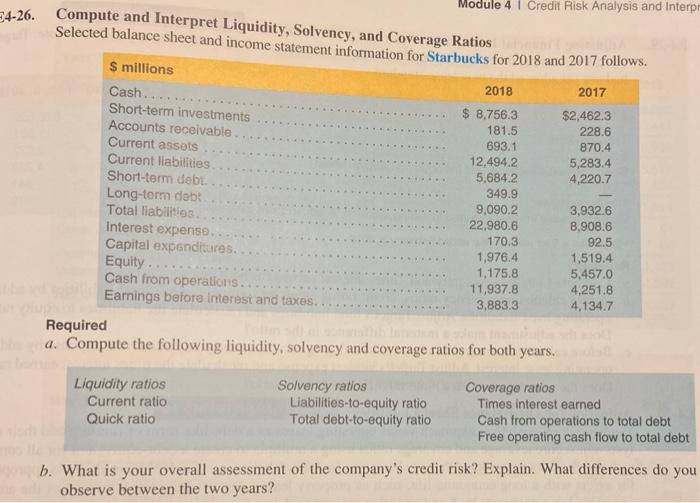
E4-26. Module 4 | Credit Risk Analysis and Interpe Compute and Interpret Liquidity, Solvency, and Coverage Ratios Selected balance sheet and income statement information for Starbucks for 2018 and 2017 follows. $ millions 2018 2017 Cash...... Short-term investments $ 8.756.3 $2.462.3 Accounts receivable 181.5 228.6 Current assets 693.1 870.4 Current liabilities 12,494.2 5,283.4 Short-term debu 5,684.2 4,220.7 349.9 Long-tom deb 9,090.2 3,932.6 Total liabilities 22,980.6 8,908.6 Interest expense 170.3 Capital expenditures. 1,976.4 1,519.4 Equity 1,175.8 5,457.0 Cash from operations. 11,937.8 4,251.8 Earnings before interest and taxes. 3,883.3 4.134.7 92.5 Required a. Compute the following liquidity, solvency and coverage ratios for both years. Liquidity ratios Current ratio Quick ratio Solvency ratios Liabilities-to-equity ratio Total debt-to-equity ratio Coverage ratios Times interest earned Cash from operations to total debt Free operating ca flow to total debt b. What is your overall assessment of the company's credit risk? Explain. What differences do you observe between the two years
Step by Step Solution
There are 3 Steps involved in it

Get step-by-step solutions from verified subject matter experts