

Question: $Ea 2}) Insert Table Chart Text Shape Media Format Document 1' A survey of 1250 people asked how often they used the internet, 96 responded
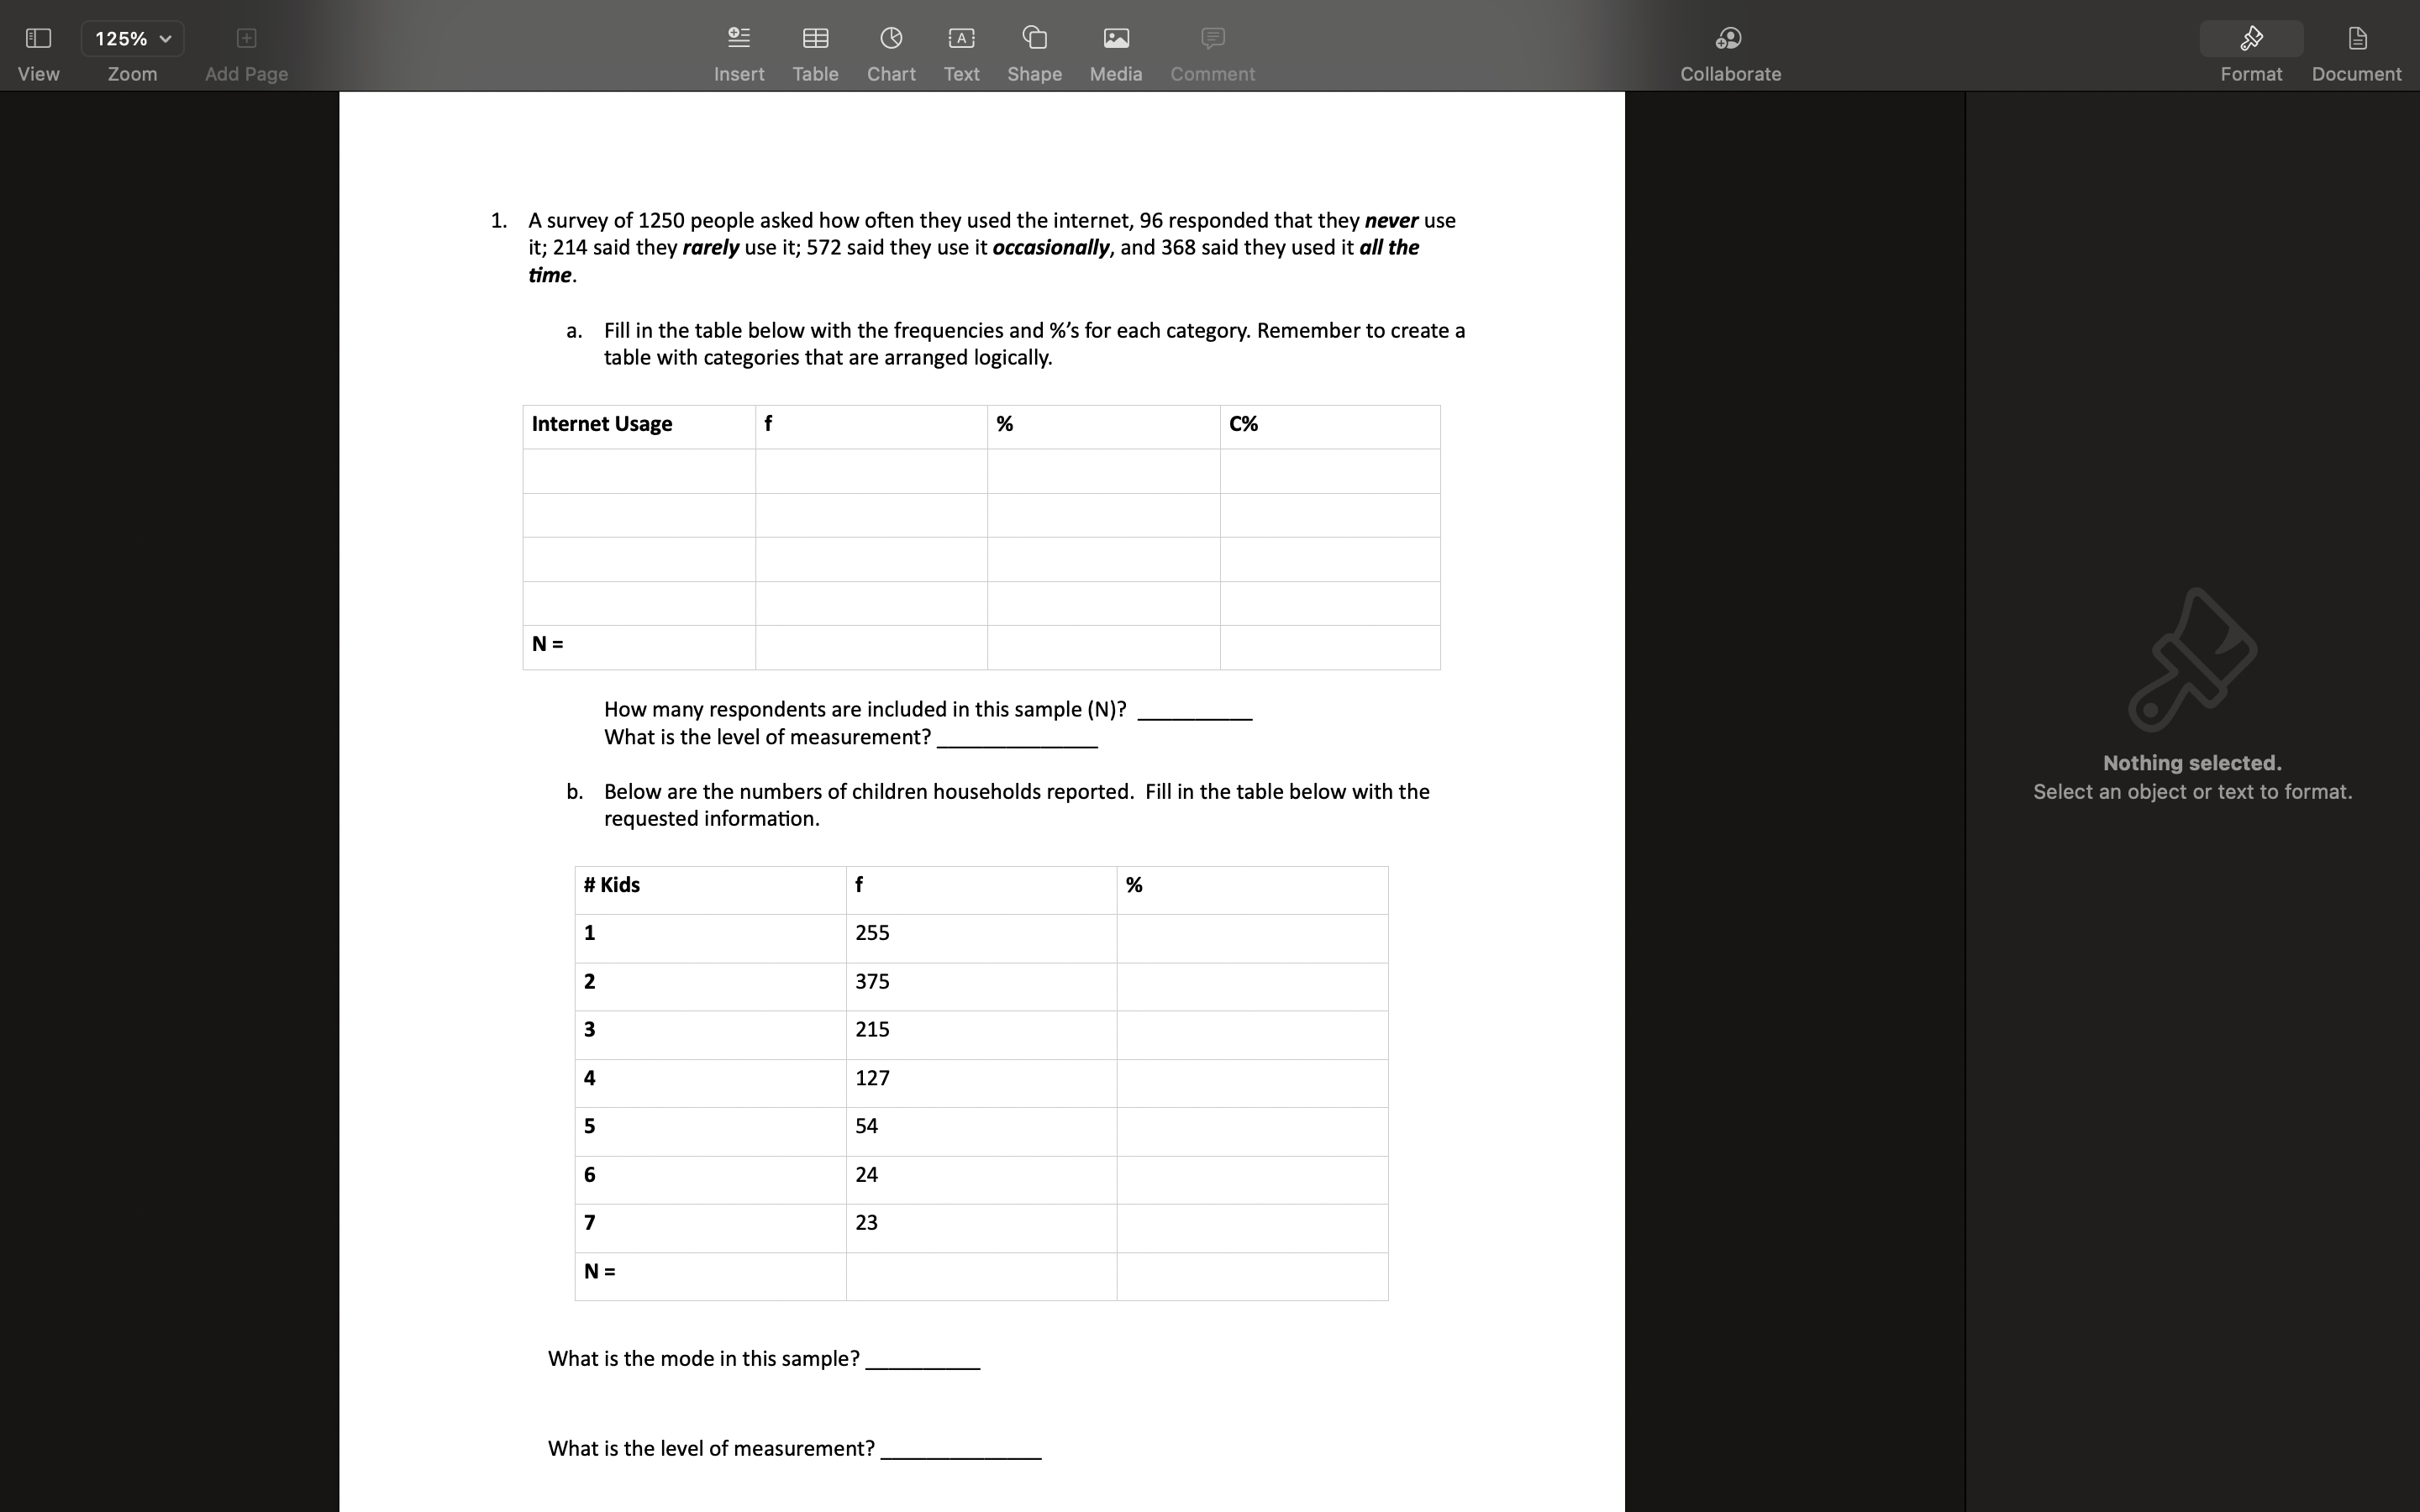
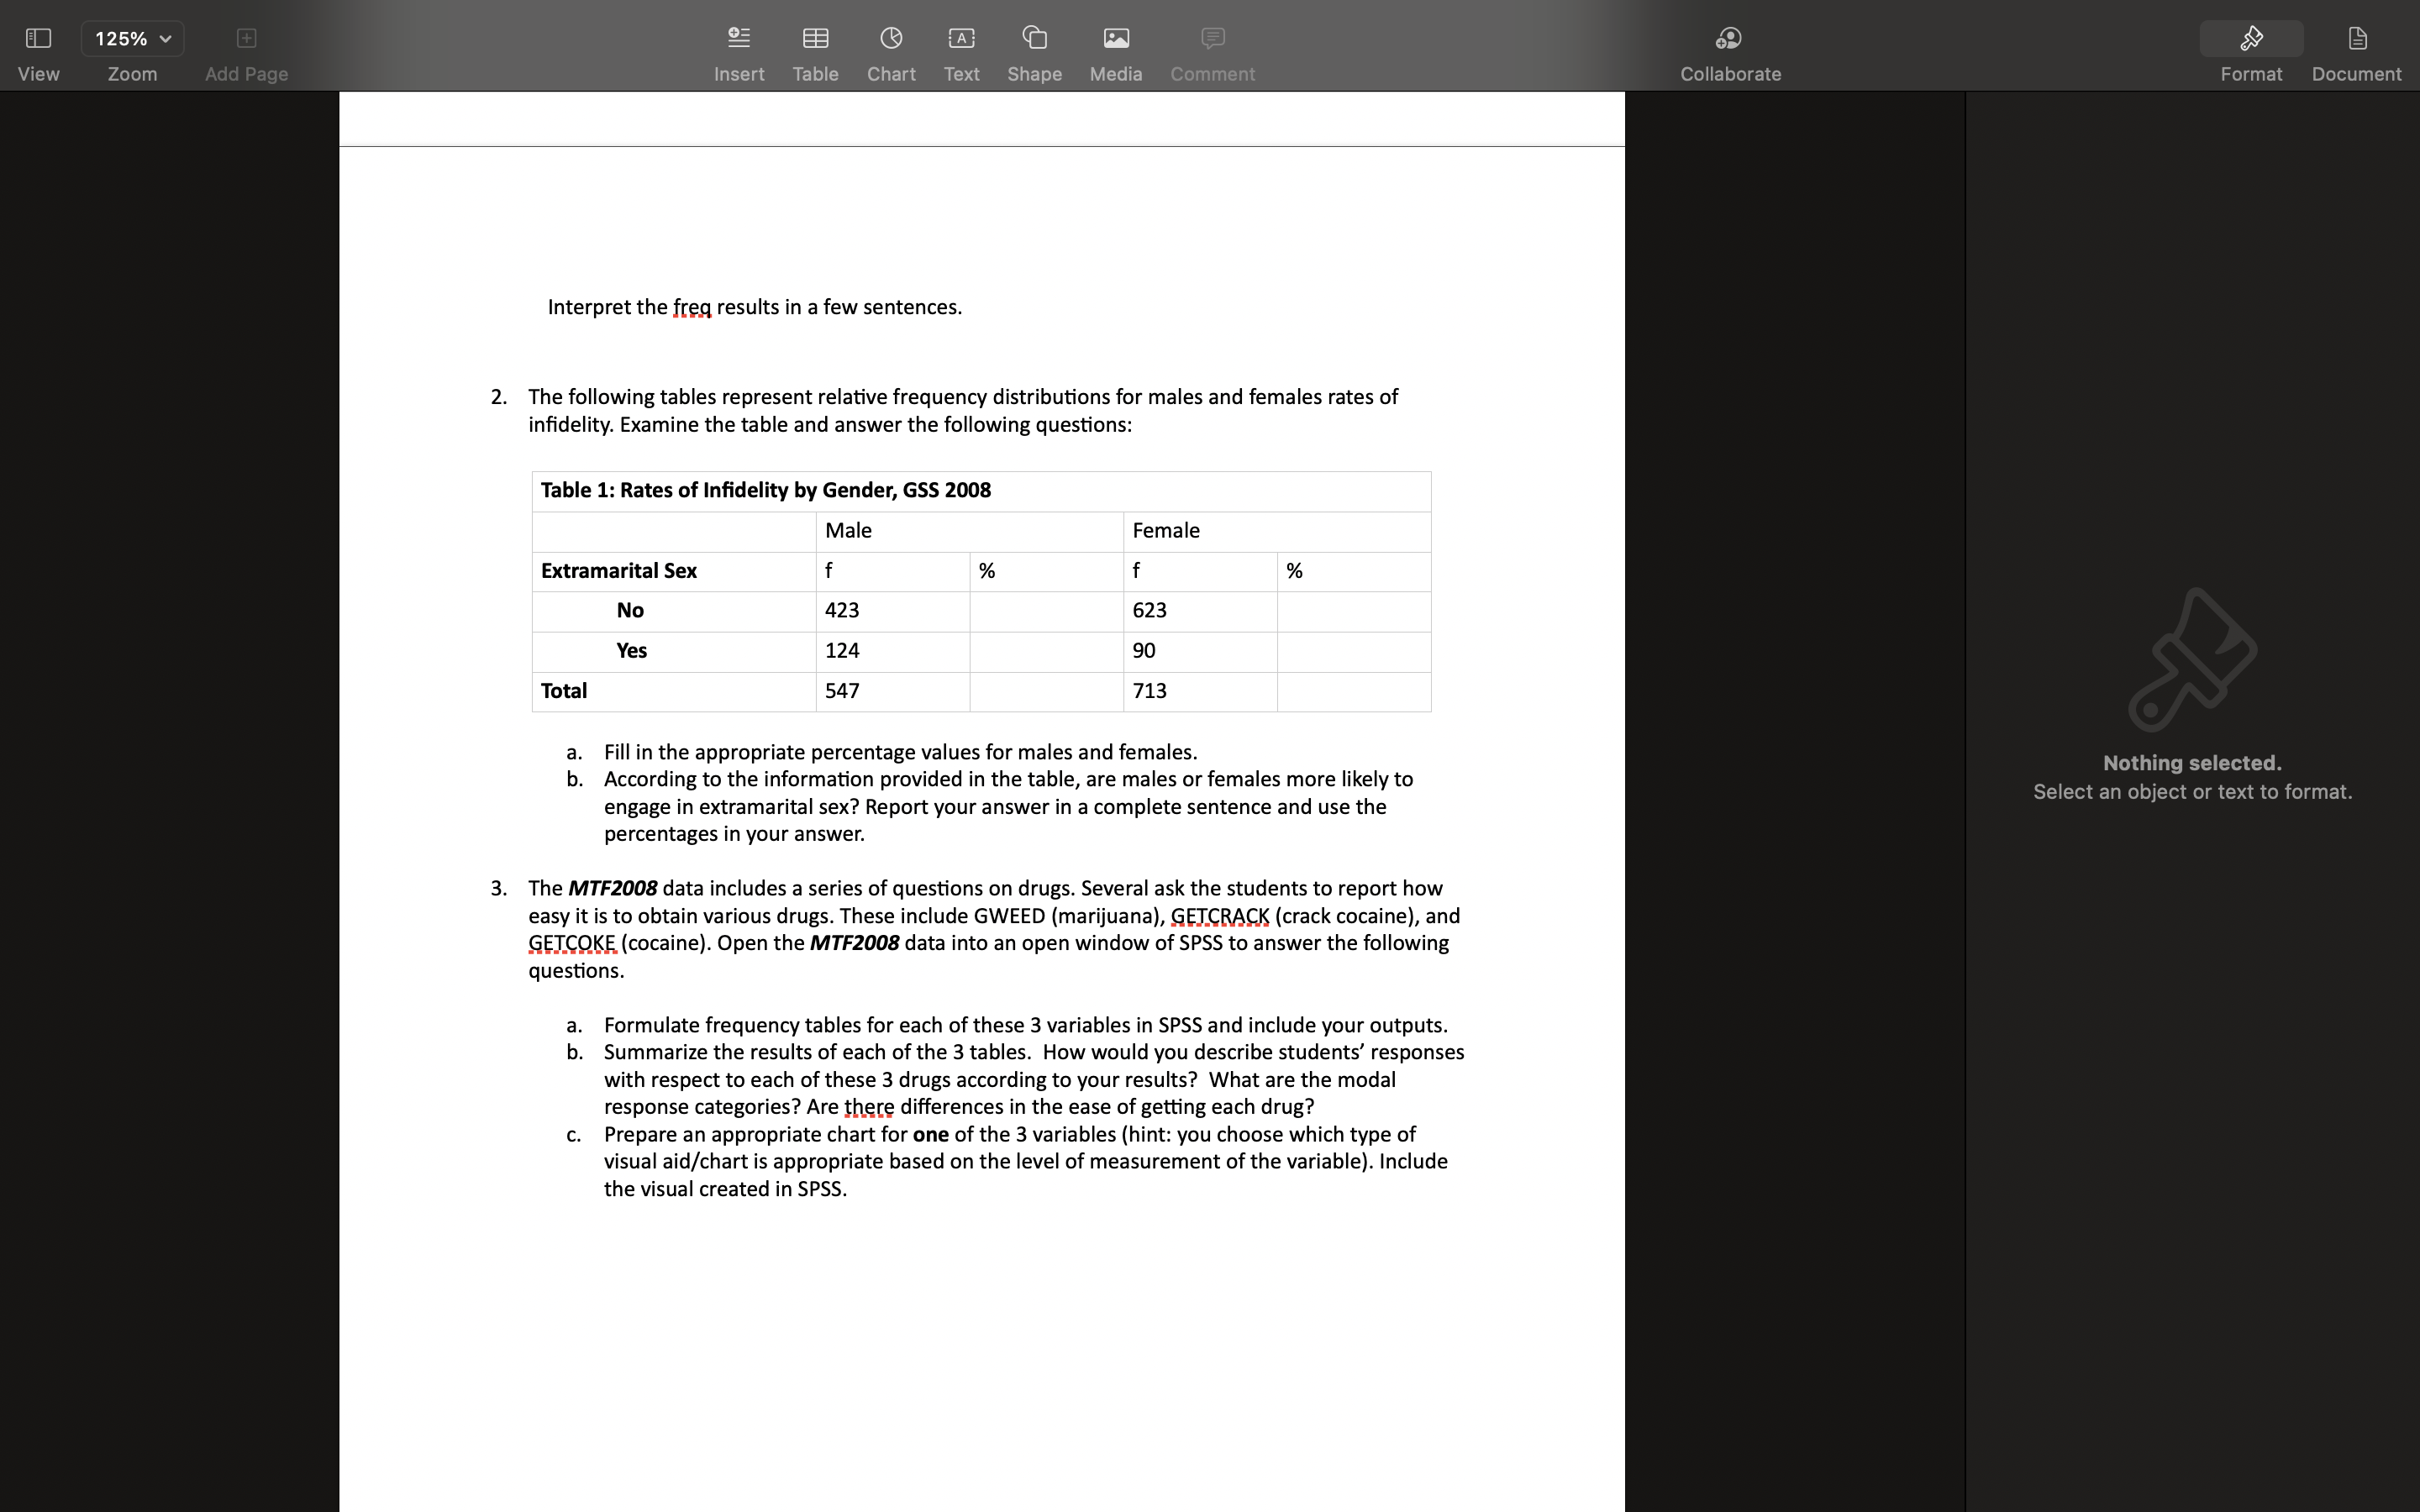
$Ea 2}) Insert Table Chart Text Shape Media Format Document 1' A survey of 1250 people asked how often they used the internet, 96 responded that they never use it; 214 said they rarely use it; 572 said they use it occasionally, and 368 said they used it all the time. at Fill in the table below with the frequencies and %'s for each category. Remember to create a table with categories that are arranged logically. Internet Usage 96 How many respondents are included in this sample (N)? What is the level of measurement? Nothing selected' Below are the numbers of children households reported. Fill in the table below with the Select an OlJJDCt or text to format requested information. it Kids 1 2 What is the mode in this sample? What is the level of measurement? $Ea 2}) Insert Table Chart Text Shape Media Format Document Interpret the fret: results in a few sentences. 2. The following tables represent relative frequency distributions for males and females rates of indelity. Examine the table and answer the following questions: Table 1: Rates of Indelity by Gender, 555 2008 Male Extramarital Sex f % No 423 124 90 547 713 Fill In the appropriate percentage values for males and females. Nothing selected. According to the information provided in the table, are males or females more likely to engage in extramarital sex? Report your answer in a complete sentence and use the percentages in your answer. Select an ODJDCI or text to format The MTFZODB data includes a series of questions on drugs. Several ask the students to report how easy it is to obtain various drugs. These include GWEED (marijuana), GEICRAQK (crack cocaine), and EJjCQK (cocaine). Open the MTF2008 data into an open window of SPSS to answer the following questions. Formulate frequency tables for each of these 3 variables in SPSS and include your outputs. Summarize the results of each of the 3 tables. How would you describe students' responses with respect to each of these 3 drugs according to your results? What are the modal response categories? Are there differences in the ease of getting each drug? Prepare an appropriate chart for one of the 3 variables (hint: you choose which type of visual aid/chart is appropriate based on the level of measurement of the variable). Include the visual created in SPSS
Step by Step Solution
There are 3 Steps involved in it

Get step-by-step solutions from verified subject matter experts