

Question: each answer needs to be answered with an excel formula, you can not type in any numbers. thank you! XB55 - 5 x FILE HOME
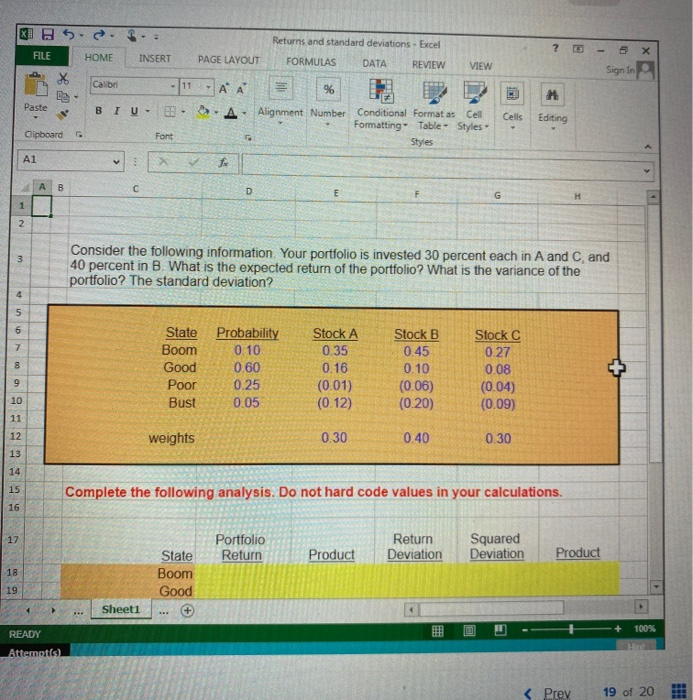
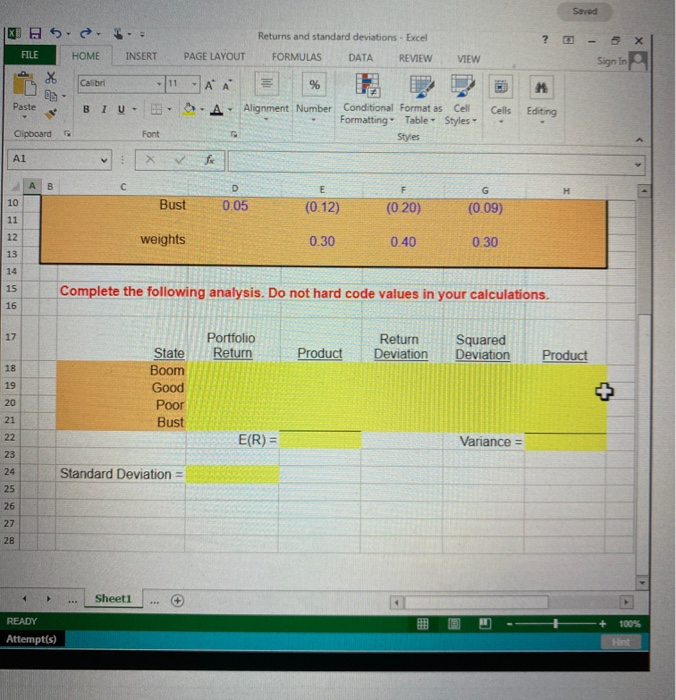
XB55 - 5 x FILE HOME INSERT Sign in X Calibri - 11 Returns and standard deviations - Excel PAGE LAYOUT FORMULAS DATA REVIEW VIEW JA A % A Alignment Number Conditional Format as Cell Formatting" Table - Styles Styles M Paste BIU- Cells Editing Clipboard Font A1 3 fo B C D E F G 1 2. 3 Consider the following information. Your portfolio is invested 30 percent each in A and C, and 40 percent in B. What is the expected return of the portfolio? What is the variance of the portfolio? The standard deviation? 4 5 6 7 8 State Boom Good Poor Bust Probability 0.10 0.60 0.25 0.05 Stock A 0.35 0.16 (0.01) (0.12) Stock B 0.45 0.10 (0.06) (0.20) Stock C 027 0.08 (0.04) (0.09) 9 10 11 12 weights 0.30 0.40 0.30 13 14 15 Complete the following analysis. Do not hard code values in your calculations. 16 17 Portfolio Return Return Deviation Squared Deviation Product Product 18 State Boom Good 19 Sheet1 READY 100% Attempts)
Step by Step Solution
There are 3 Steps involved in it

Get step-by-step solutions from verified subject matter experts