

Question: Each breakdown of a graphic plotter table at Airbus Industries costs . Following is the historical breakdown distribution: Each breakdown of a graphic plotter table
Each breakdown of a graphic plotter table at Airbus Industries costs . Following is the historical breakdown distribution: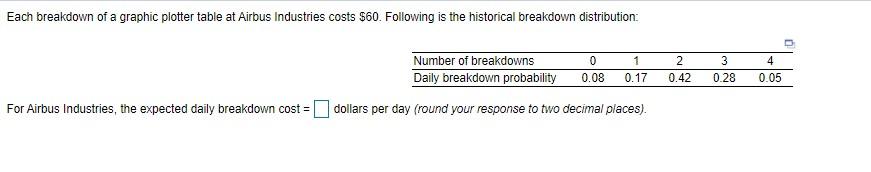
Step by Step Solution
There are 3 Steps involved in it
1 Expert Approved Answer
Step: 1 Unlock

Question Has Been Solved by an Expert!
Get step-by-step solutions from verified subject matter experts
Step: 2 Unlock
Step: 3 Unlock