

Question: Each dataset includes information obtained from a 3 - min step incremental exercise test on a ergometer. During each stage, the power output ( W
Each dataset includes information obtained from a min step incremental exercise test on a ergometer.
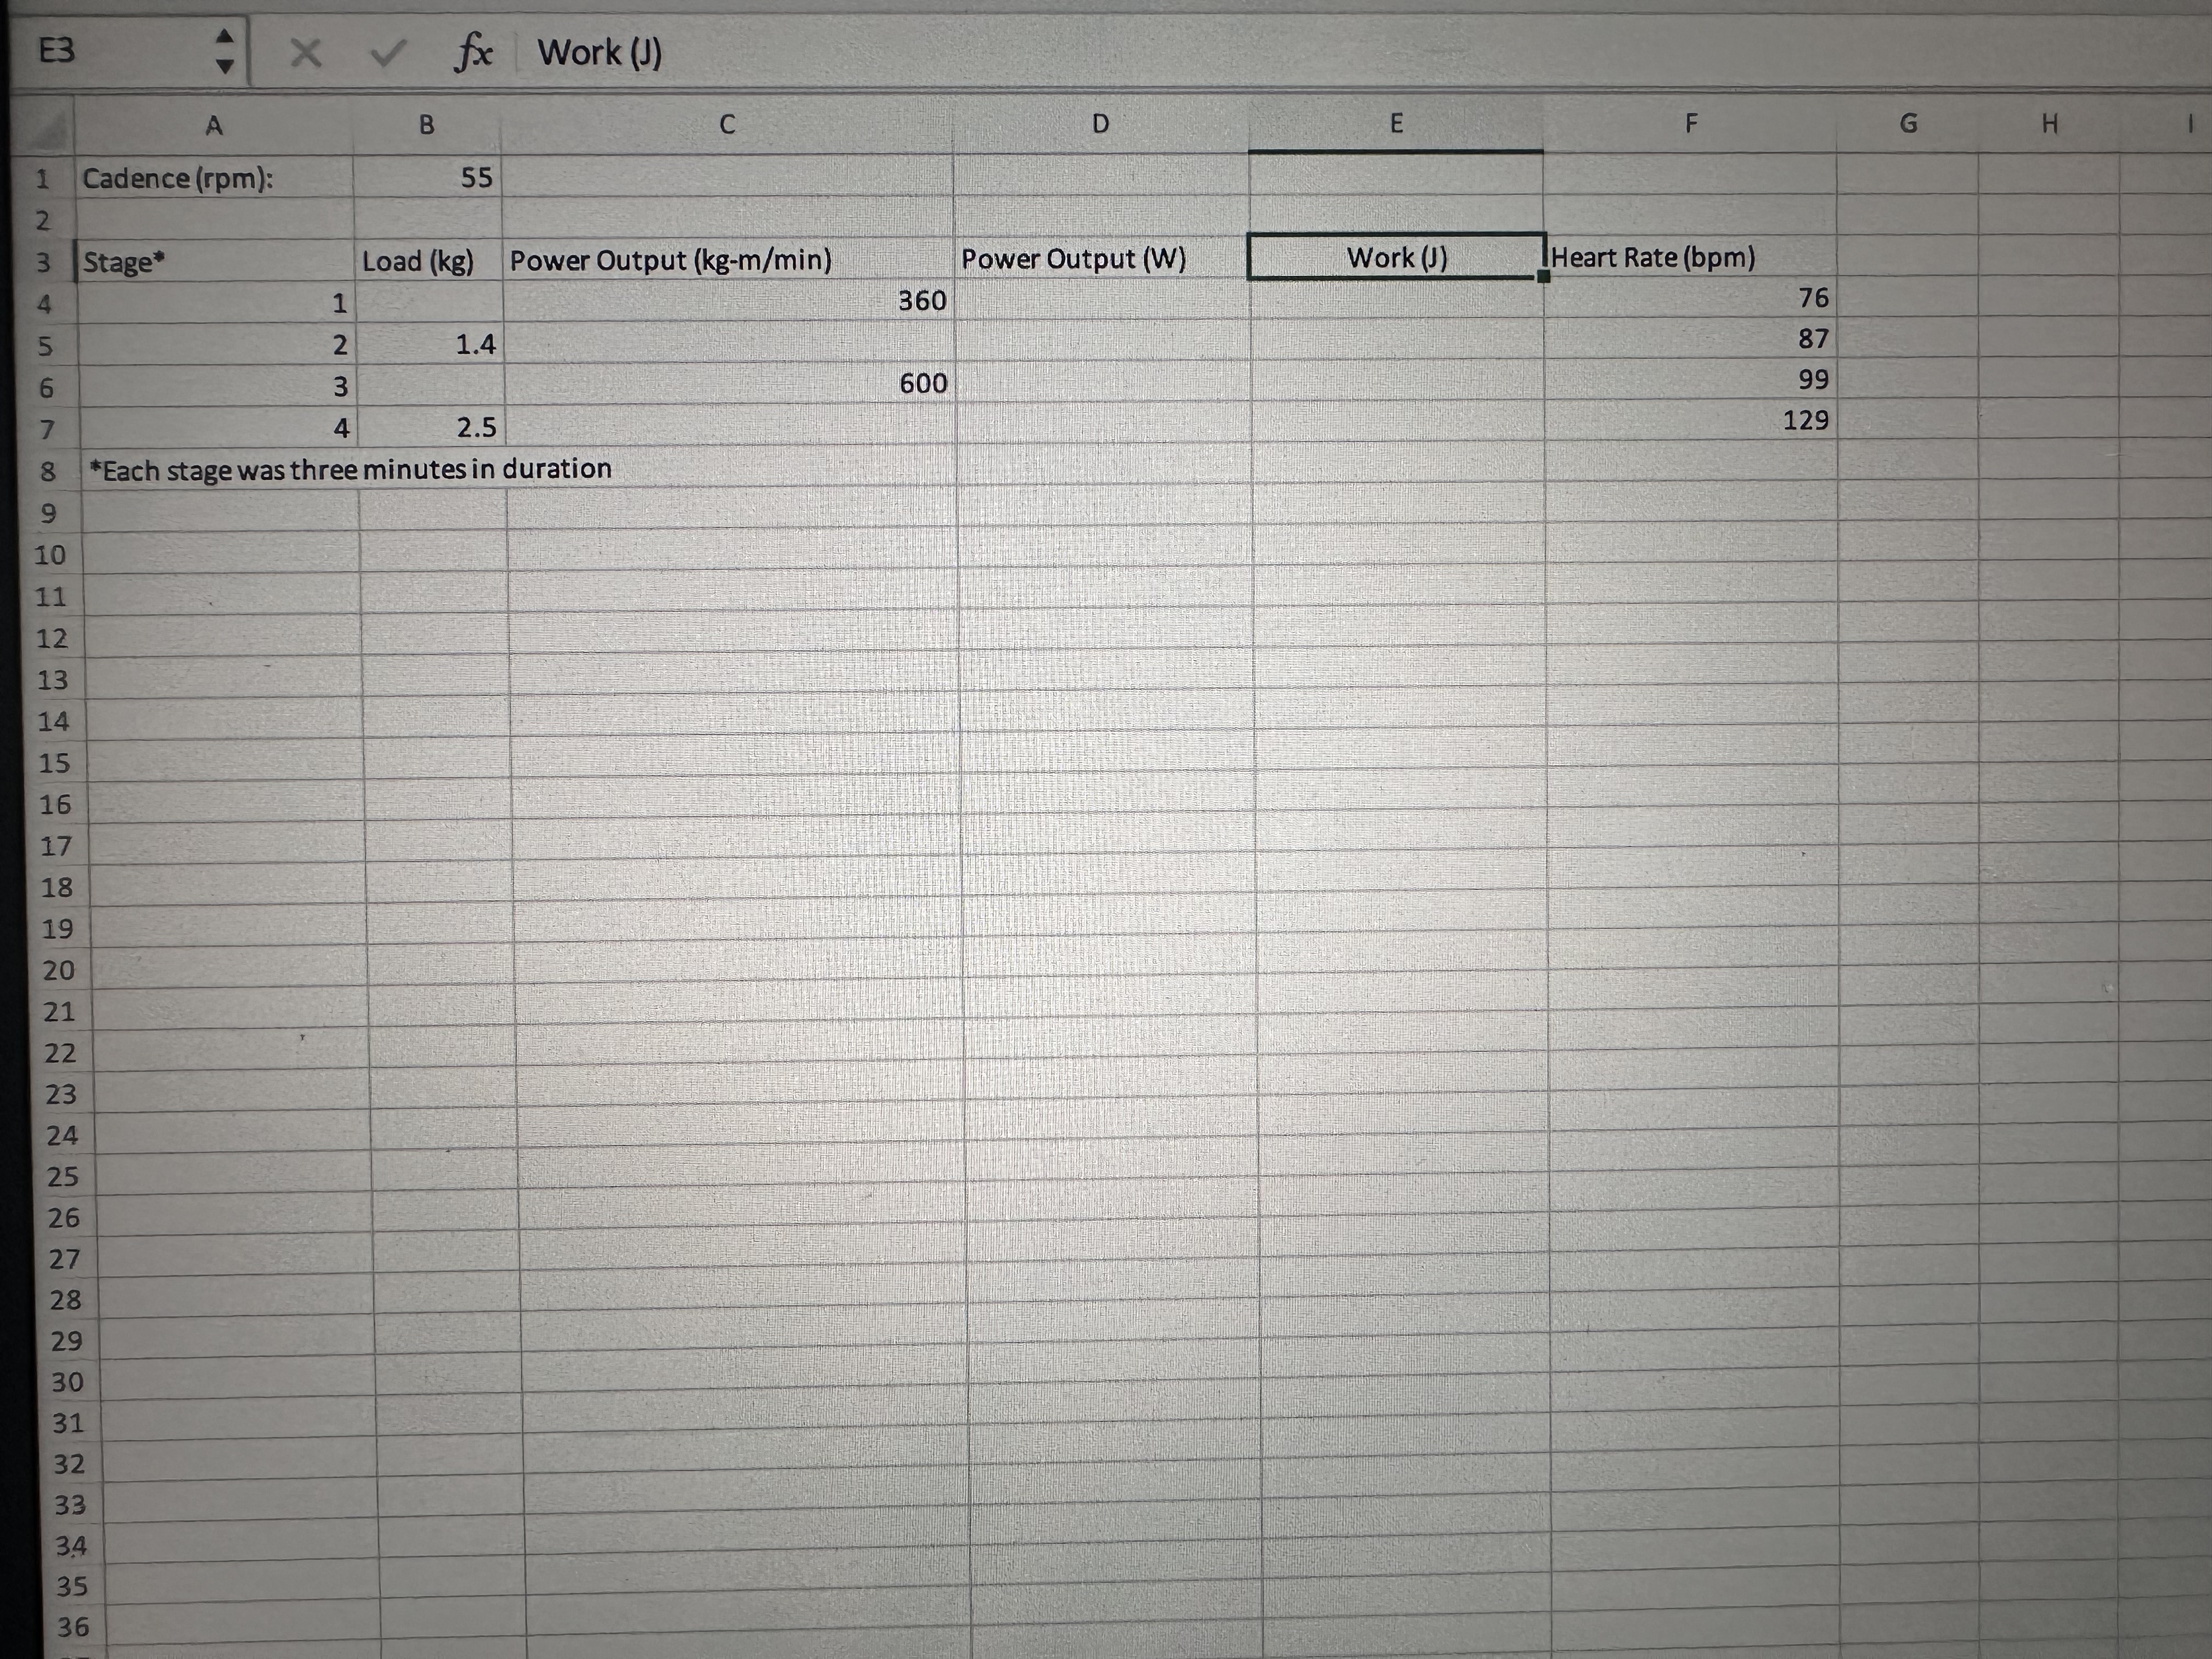
During each stage, the power output W increased, and the experimenter measured the participants resulting heart rate.
Note that each dataset has a unique set of heart rates and cadence used during this incremental exercise test.
Solve for the missing values in columns A load in kg and B power output in kgmmin in your Excel dataset. After
solving for the missing values in columns A and B convert power output from kgmmin to W using the conversion
W kgmmin Last, determine the amount of work J done while cycling for three minutes at each stage.
Create a table formatted following APA guidelines that includes all the data reported in your Excel spreadsheet ie
your table should include a column for load kg power output kgmmin power output W heart rate bmin
and work J
Create a xy scatter plot using the values from your dataset showing the relationship between power output W and heart rate bmin When plotting your values, consider what is the
independent variable xaxis and dependent variable yaxis in this example
Step by Step Solution
There are 3 Steps involved in it
1 Expert Approved Answer
Step: 1 Unlock

Question Has Been Solved by an Expert!
Get step-by-step solutions from verified subject matter experts
Step: 2 Unlock
Step: 3 Unlock