

Question: Each dot in the following dot plot represents the number of goals Luis scored in one lacrosse season. H ++ 43 44 45 46
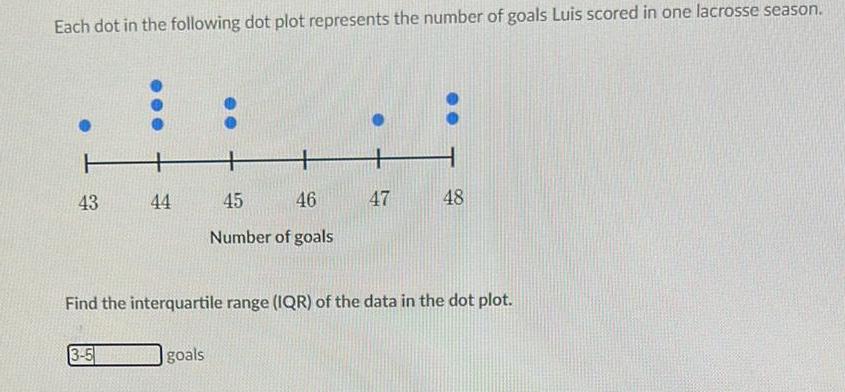
Each dot in the following dot plot represents the number of goals Luis scored in one lacrosse season. H ++ 43 44 45 46 47 48 Number of goals Find the interquartile range (IQR) of the data in the dot plot. 3-5 goals
Step by Step Solution
There are 3 Steps involved in it
1 Expert Approved Answer
Step: 1 Unlock

Question Has Been Solved by an Expert!
Get step-by-step solutions from verified subject matter experts
Step: 2 Unlock
Step: 3 Unlock