

Question: Each investment return must also be compared to a comparable benchmark to assess if the investment has over- or underperformed during the last 12 months.
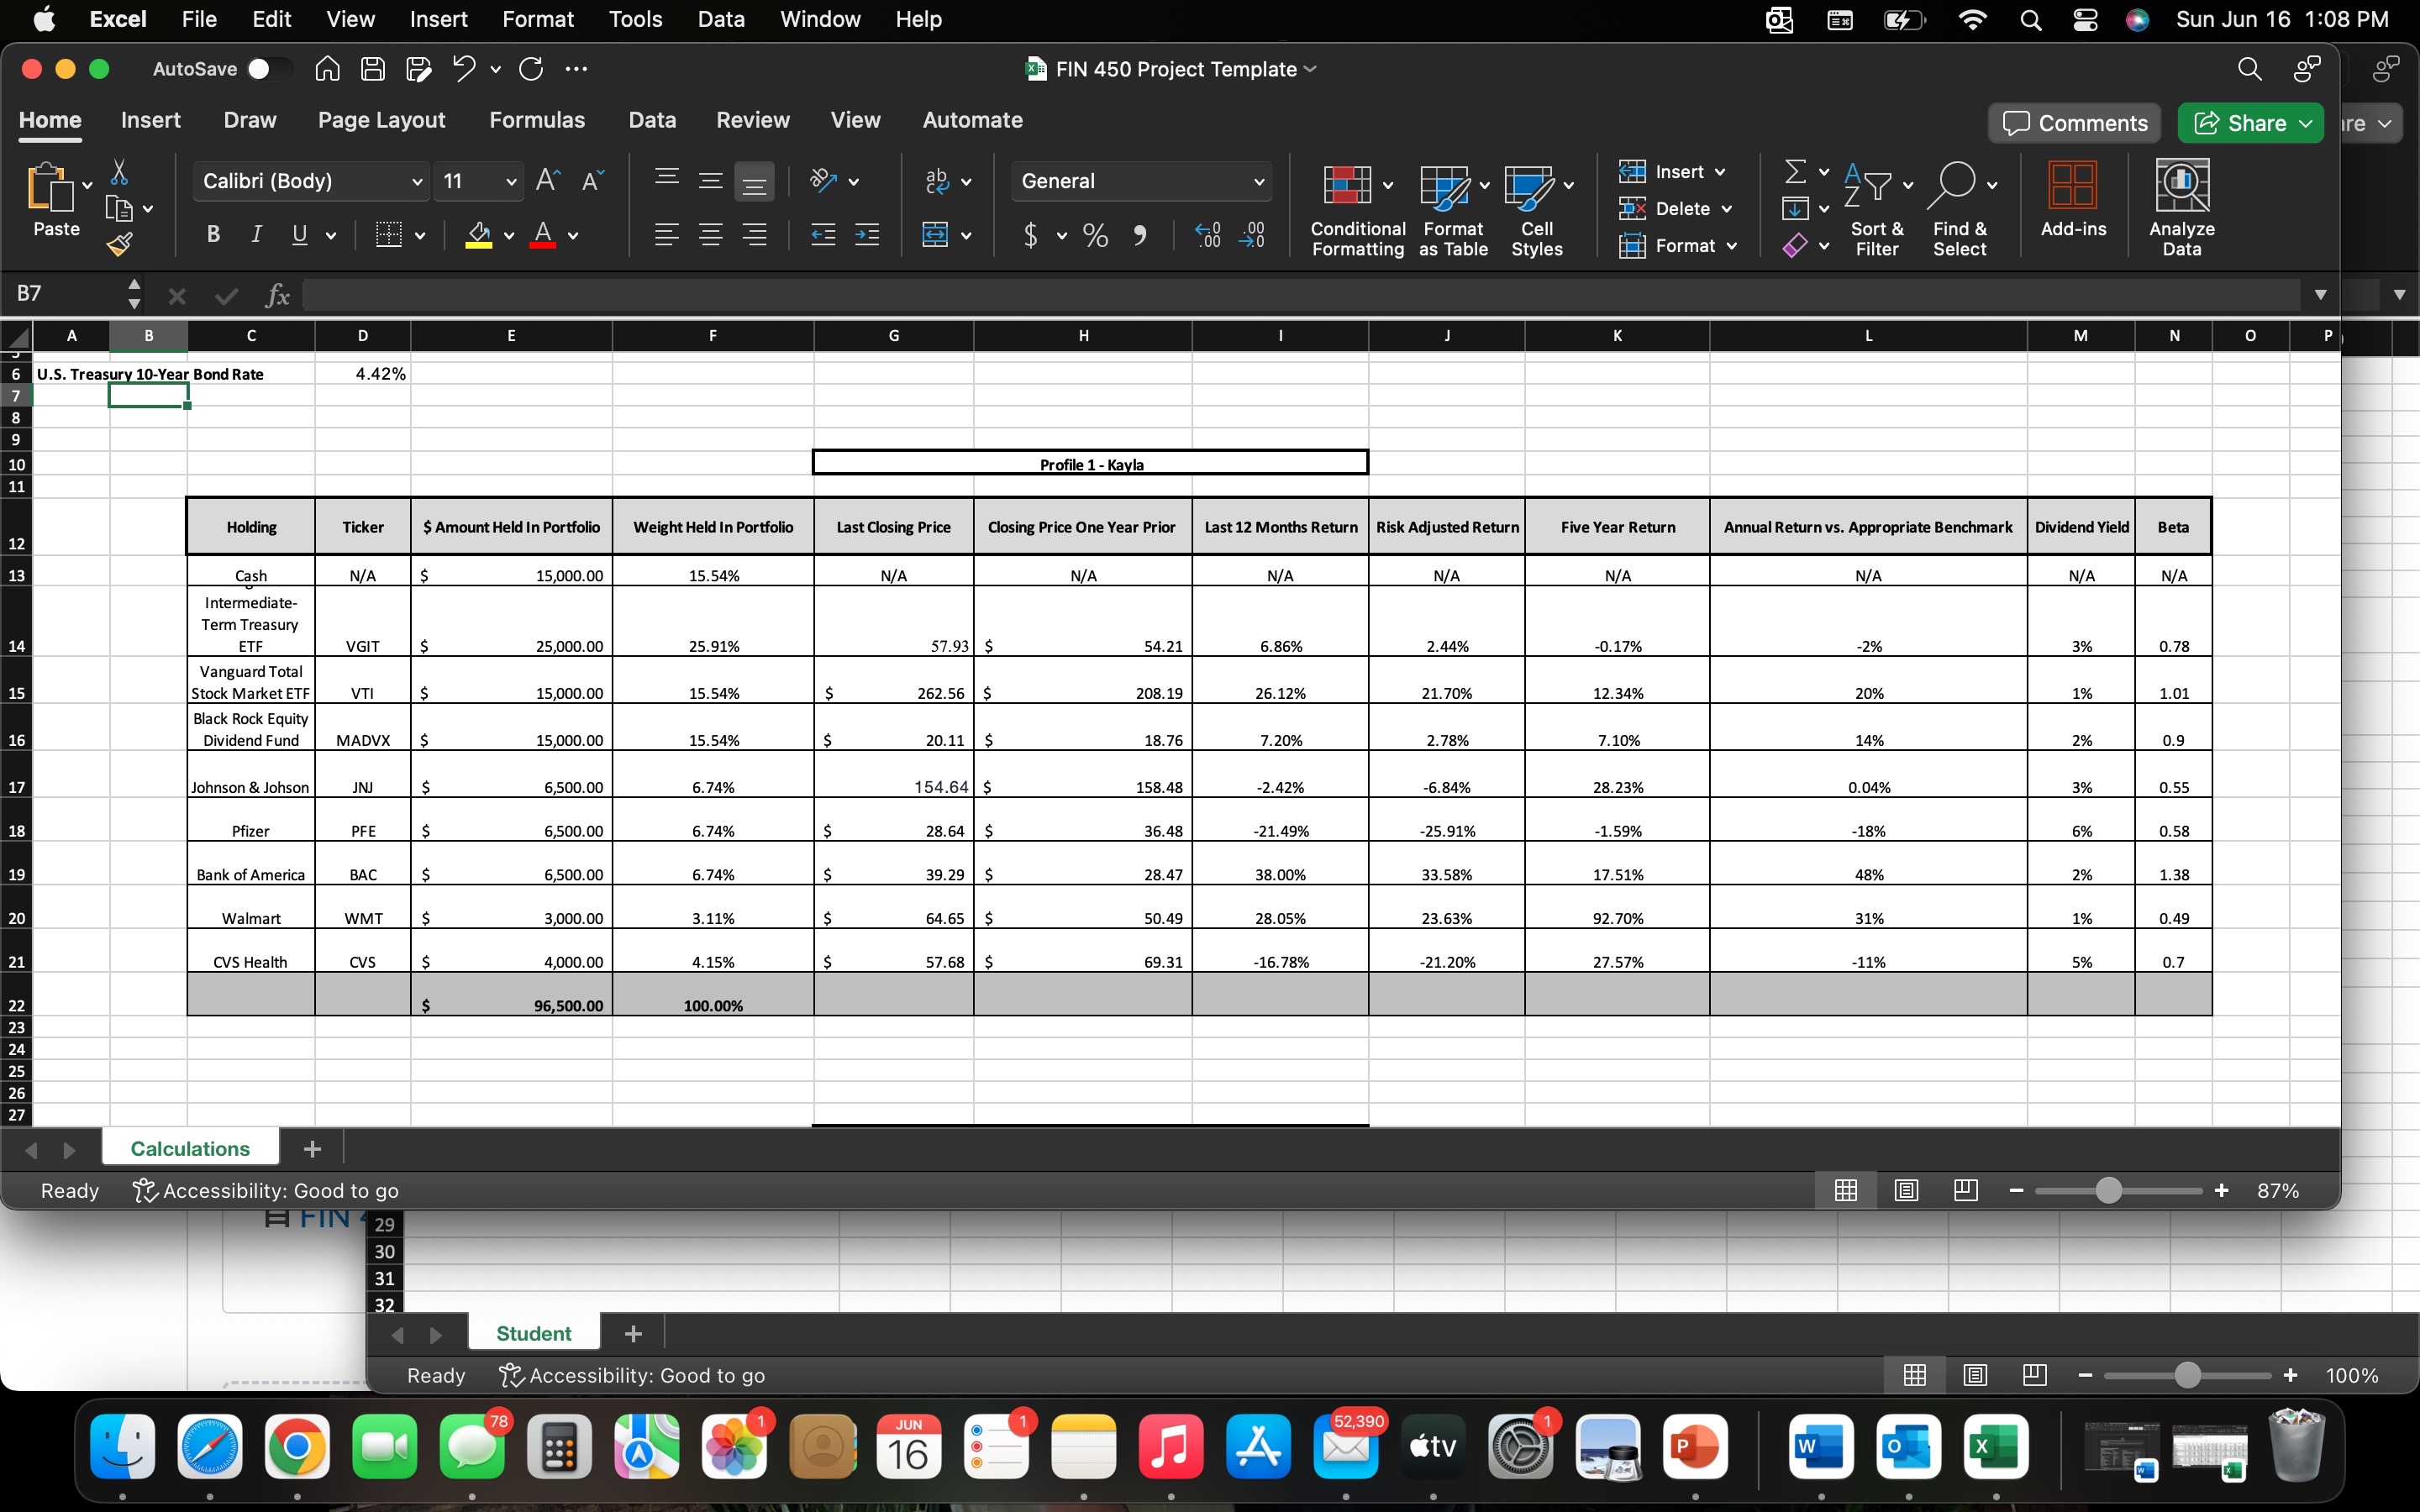
- Each investment return must also be compared to a comparable benchmark to assess if the investment has over- or underperformed during the last 12 months. You can compare the last 12-month return of your investment to the last 12-month return of a bond index when the investment is a bond, a large stock market index when the investment is a stock, or individual stocks when the investment is a stock, and so on. Find a comparable benchmark and enter the difference between the portfolio investment's return and the benchmark in column L.
Specifically, you must address the following rubric criteria:
- Analyze past portfolio performance. Include the following in your calculations:
- Quantitative assessments from:
- Annual return
- Risk-adjusted return
- Five-year return
- Annual return versus appropriate benchmark
- Quantitative assessments from:
- Compare portfolio investments to relevant benchmarks. Include the following in your calculations and summary:
- Identify benchmarks for existing investments to be compared to, and identify the reason for benchmark selection.
- Discuss return data on investments within the portfolio.
- Identify over- and underperforming investments in relation to each benchmark
Step by Step Solution
There are 3 Steps involved in it
1 Expert Approved Answer
Step: 1 Unlock

Question Has Been Solved by an Expert!
Get step-by-step solutions from verified subject matter experts
Step: 2 Unlock
Step: 3 Unlock