

Question: Each of the four graphs below represents the same raw data. Describe how the graph construction influenced the visual analysis. No references fffDisruptive Behavior A1
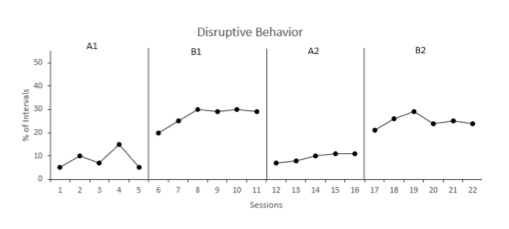
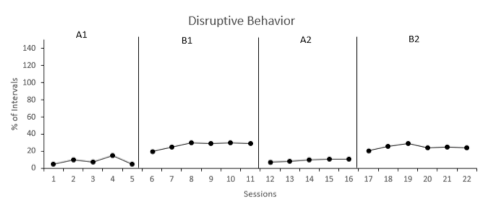
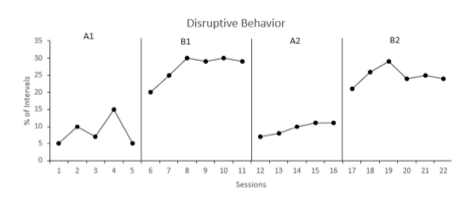
Each of the four graphs below represents the same raw data. Describe how the graph construction influenced the visual analysis.
No references 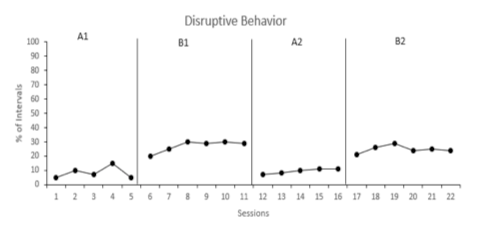
 \f\f\fDisruptive Behavior A1 81 A2 82 75 % of Intervals 7 10 11 12 10 14 15 16 17 18 19 20 21 22 Sessions
Step by Step Solution
There are 3 Steps involved in it
1 Expert Approved Answer
Step: 1 Unlock

Question Has Been Solved by an Expert!
Get step-by-step solutions from verified subject matter experts
Step: 2 Unlock
Step: 3 Unlock