

Question: Each problem in this assignment asks you to write your own R function. Follow the instructions given and submit the code for your function as
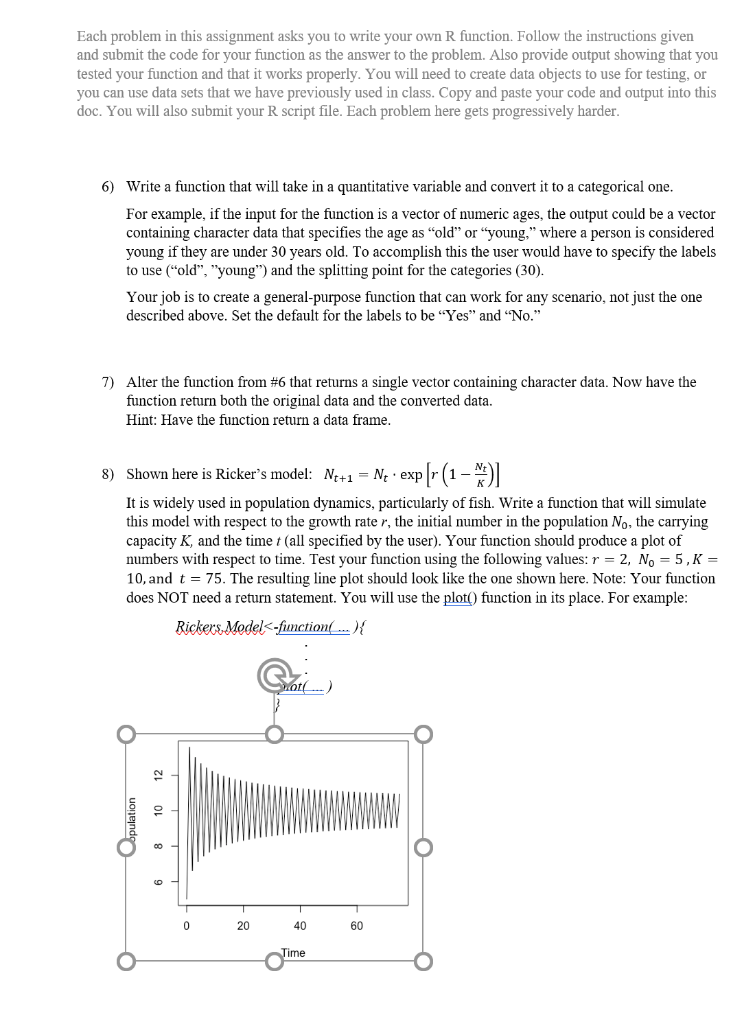
Each problem in this assignment asks you to write your own R function. Follow the instructions given and submit the code for your function as the answer to the problem. Also provide output showing that you tested your function and that it works properly. You will need to create data objects to use for testing, or you can use data sets that we have previously used in class. Copy and paste your code and output into this doc. You will also submit your R script file. Each problem here gets progressively harder. 6) Write a function that will take in a quantitative variable and convert it to a categorical one. For example, if the input for the function is a vector of numeric ages, the output could be a vector containing character data that specifies the age as "old" or "young," where a person is considered young if they are under 30 years old. To accomplish this the user would have to specify the labels to use ("old", "young") and the splitting point for the categories (30). Your job is to create a general-purpose function that can work for any scenario, not just the one described above. Set the default for the labels to be "Yes" and "No." 7) Alter the function from #6 that returns a single vector containing character data. Now have the function return both the original data and the converted data. Hint: Have the function return a data frame. 8) Shown here is Rickers model: Nq+1 = Ne exp[r (1-x) It is widely used in population dynamics, particularly of fish. Write a function that will simulate this model with respect to the growth rate r, the initial number in the population No, the carrying capacity K, and the time t (all specified by the user). Your function should produce a plot of numbers with respect to time. Test your function using the following values: r = 2, No = 5,K = 10, and t = 75. The resulting line plot should look like the one shown here. Note: Your function does NOT need a return statement. You will use the plot() function in its place. For example: Rickers. Model
Step by Step Solution
There are 3 Steps involved in it

Get step-by-step solutions from verified subject matter experts