

Question: Each question below should be addressed in a different Excel spreadsheet. ASSIGNMENT 1. Download from Bloomberg five years of historical weekly returns for 4 stocks
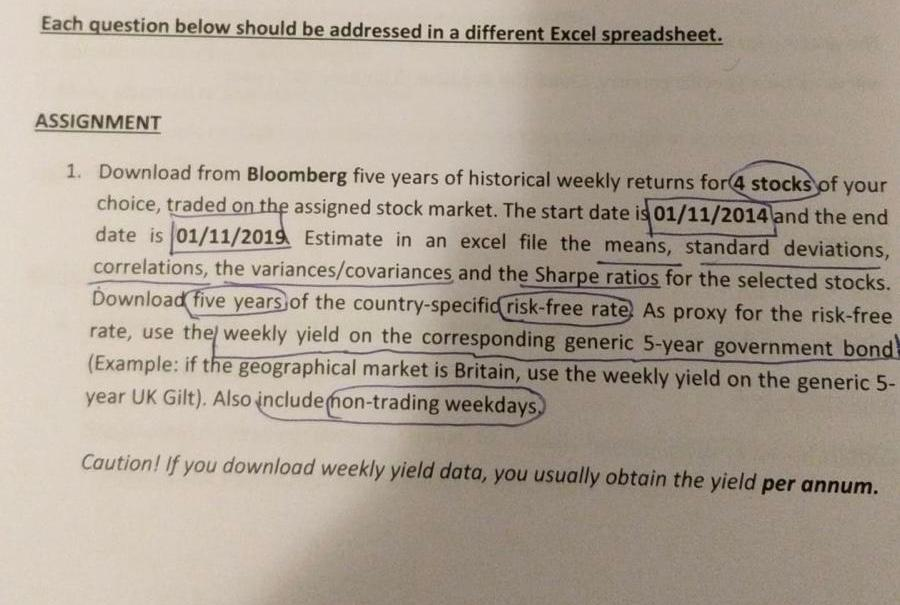
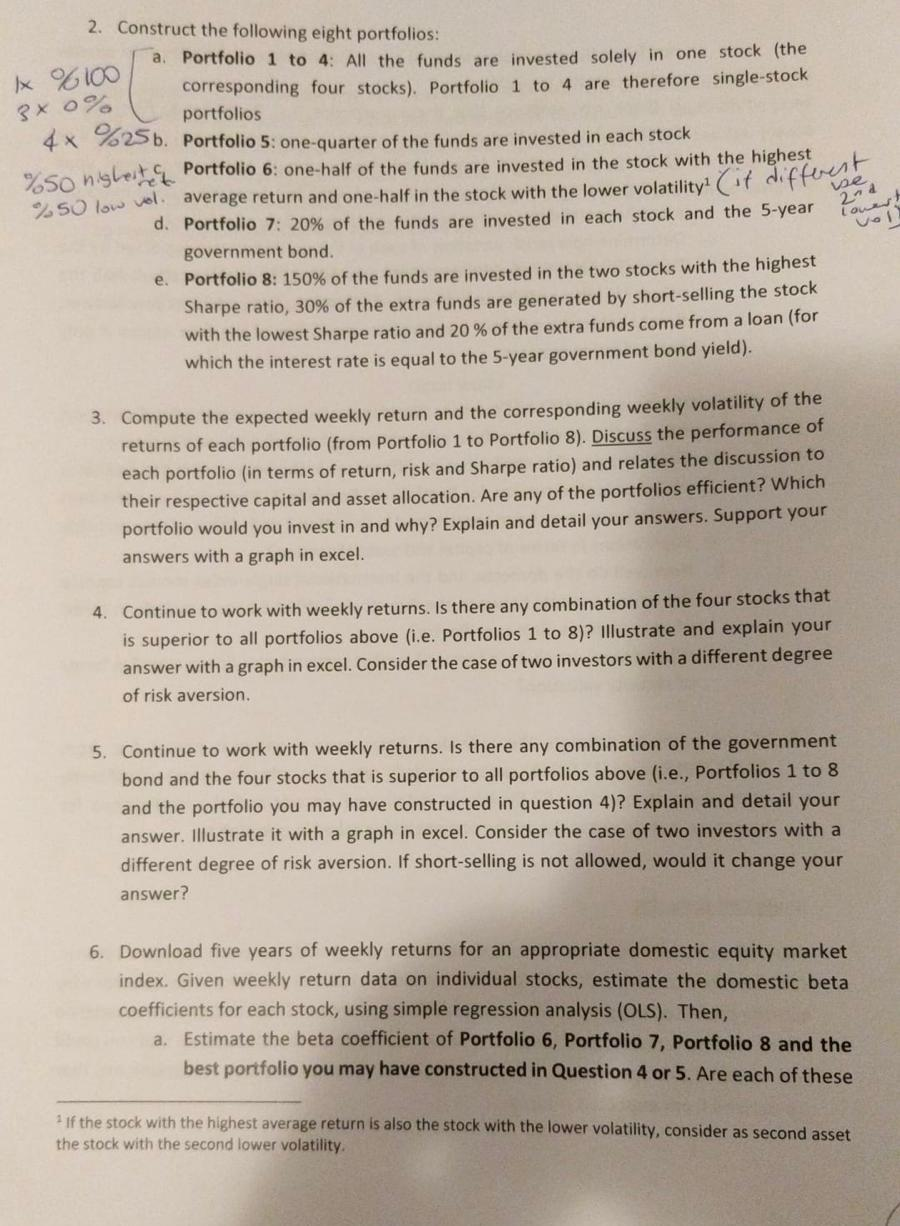
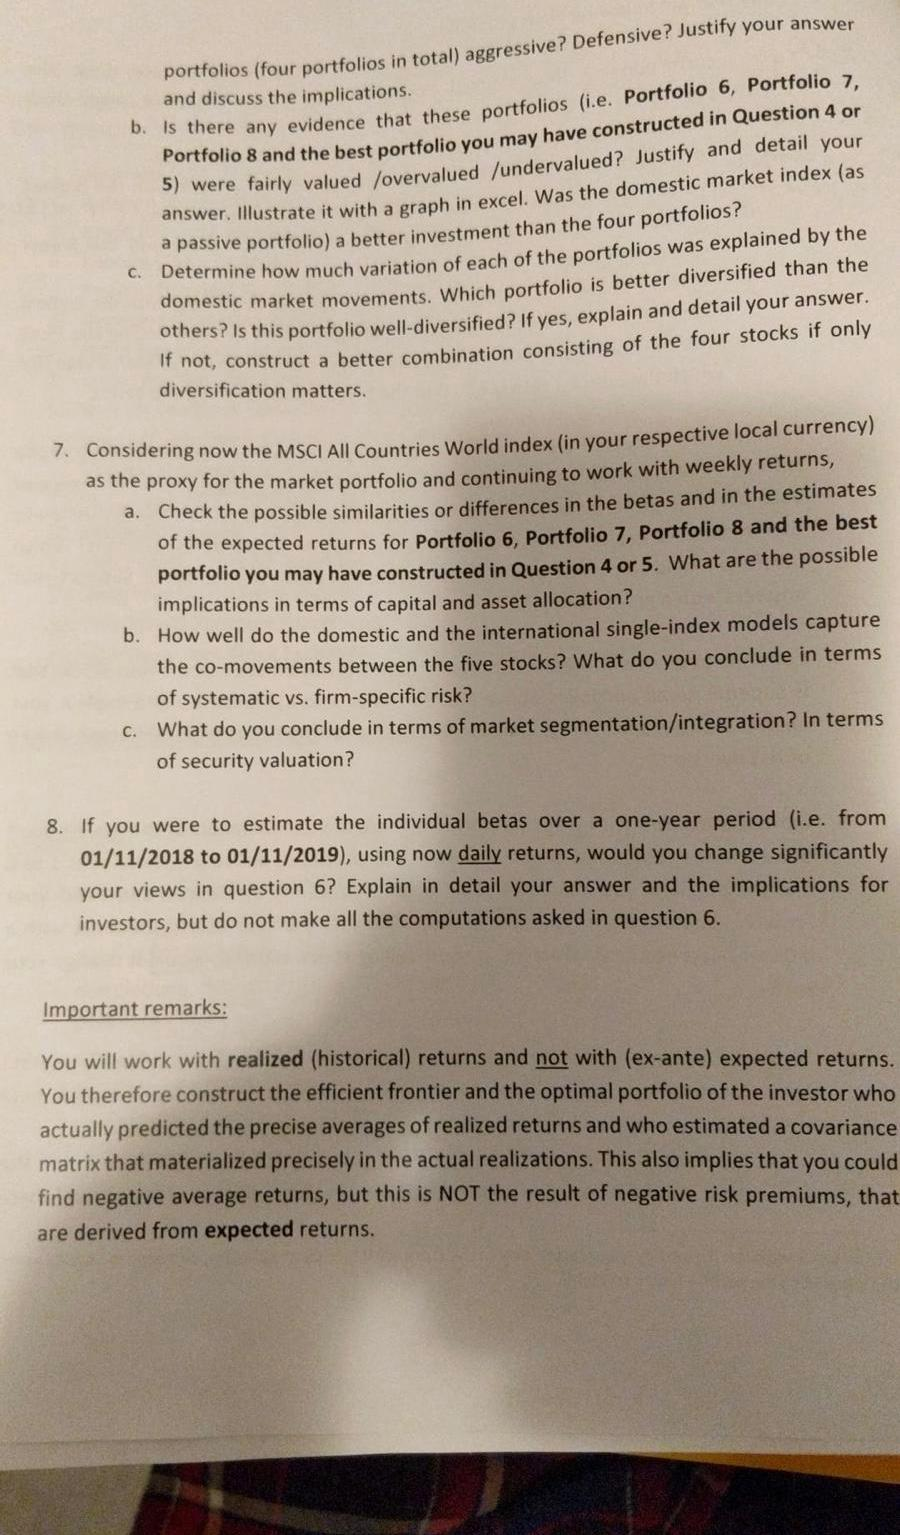

Each question below should be addressed in a different Excel spreadsheet. ASSIGNMENT 1. Download from Bloomberg five years of historical weekly returns for 4 stocks of your choice, traded on the assigned stock market. The start date is 01/11/2014 and the end date is 01/11/2019 Estimate in an excel file the means, standard deviations, correlations, the variances/covariances and the Sharpe ratios for the selected stocks. Download five years of the country-specific risk-free rate As proxy for the risk-free rate, use the weekly yield on the corresponding generic 5-year government bond (Example: if the geographical market is Britain, use the weekly yield on the generic 5- year UK Gilt). Also include(non-trading weekdays Caution! If you download weekly yield data, you usually obtain the yield per annum. 2. Construct the following eight portfolios: Portfolio 1 to 4: All the funds are invested solely in one stock (the x 6 LP 7 corresponding four stocks). Portfolio 1 to 4 are therefore single-stock 2 x 70 portfolios b. Portfolio 5: one-quarter of the funds are invested in each stock Sonighest Portfolio 6: one-half of the funds are invested in the stock with the highest 55 low vol average return and one-half in the stock with the lower volatility d. Portfolio 7: 20% of the funds are invested in each stock and the 5-year government bond. e Portfolio 8: 150% of the funds are invested in the two stocks with the highest Sharpe ratio, 30% of the extra funds are generated by short-selling the stock with the lowest Sharpe ratio and 20% of the extra funds come from a loan (for which the interest rate is equal to the 5-year government bond yield). er volatility(of differen 3. Compute the expected weekly return and the corresponding weekly volatility of the returns of each portfolio (from Portfolio 1 to Portfolio 8). Discuss the performance of each portfolio in terms of return, risk and Sharpe ratio) and relates the discussion to their respective capital and asset allocation. Are any of the portfolios efficient? Which portfolio would you invest in and why? Explain and detail your answers. Support your answers with a graph in excel. Continue to work with weekly returns. Is there any combination of the four stocks that is superior to all portfolios above (i.e. Portfolios 1 to 8)? Illustrate and explain your answer with a graph in excel. Consider the case of two investors with a different degree of risk aversion. 5. Continue to work with weekly returns. Is there any combination of the government bond and the four stocks that is superior to all portfolios above (i.e., Portfolios 1 to 8 and the portfolio you may have constructed in question 4)? Explain and detail your answer. Illustrate it with a graph in excel. Consider the case of two investors with a different degree of risk aversion. If short-selling is not allowed, would it change your answer? 6. Download five years of weekly returns for an appropriate domestic equity market index. Given weekly return data on individual stocks, estimate the domestic beta coefficients for each stock, using simple regression analysis (OLS). Then, a. Estimate the beta coefficient of Portfolio 6, Portfolio 7, Portfolio 8 and the best portfolio you may have constructed in Question 4 or 5. Are each of these 1 If the stock with the highest average return is also the stock with the lower volatility, consider as second asset the stock with the second lower volatility Portfolios (four portfolios in total) aggressive? Defensive? Justify your answer and discuss the implications. b. Is there any evidence that Portfolio 8 and the best portfolio you here any evidence that these portfolios (i.e. Portfolio 6, Portfolio 7. 10 8 and the best portfolio you may have constructed in Question 4 or ere fairly valued /overvalued /undervalued? Justify and detail your mustrate it with a graph in excel. Was the domestic market index (as a passive portfolio) a better investment than the four portfolios? nine how much variation of each of the portfolios was explained by the stic market movements. Which portfolio is better diversified than the sr is this portfolio well-diversified? If yes, explain and detail your answer. ot, construct a better combination consisting of the four stocks if only diversification matters. 7. Considering now the MSCI All Countries W how the MSCI All Countries World index (in your respective local currency) proxy for the market portfolio and continuing to work with weekly returns, neck the possible similarities or differences in the betas and in the estimates of the expected returns for Portfolio 6, Portfolio 7, Portfolio 8 and the best portfolio you may have constructed in Question 4 or 5. What are the possible implications in terms of capital and asset allocation? b. How well do the domestic and the international single-index models capture the co-movements between the five stocks? What do you conclude in terms of systematic vs. firm-specific risk? c. What do you conclude in terms of market segmentation/integration? In terms of security valuation? 8. If you were to estimate the individual betas over a one-year period (i.e. from 01/11/2018 to 01/11/2019), using now daily returns, would you change significantly your views in question 6? Explain in detail your answer and the implications for investors, but do not make all the computations asked in question 6. Important remarks: You will work with realized (historical) returns and not with (ex-ante) expected returns. You therefore construct the efficient frontier and the optimal portfolio of the investor who actually predicted the precise averages of realized returns and who estimated a covariance matrix that materialized precisely in the actual realizations. This also implies that you could find negative average returns, but this is NOT the result of negative risk premiums, that are derived from expected returns. The written report accompanying the excel file must be clear and and justify what is done in the excel file and interpret the results computations, the Professor thus expects a clear interpretation mention your name in the excel file must be clear and comprehensive, explain excel file and interpret the results. In addition to pure us expects a clear interpretation of the results. Please Each question below should be addressed in a different Excel spreadsheet. ASSIGNMENT 1. Download from Bloomberg five years of historical weekly returns for 4 stocks of your choice, traded on the assigned stock market. The start date is 01/11/2014 and the end date is 01/11/2019 Estimate in an excel file the means, standard deviations, correlations, the variances/covariances and the Sharpe ratios for the selected stocks. Download five years of the country-specific risk-free rate As proxy for the risk-free rate, use the weekly yield on the corresponding generic 5-year government bond (Example: if the geographical market is Britain, use the weekly yield on the generic 5- year UK Gilt). Also include(non-trading weekdays Caution! If you download weekly yield data, you usually obtain the yield per annum. 2. Construct the following eight portfolios: Portfolio 1 to 4: All the funds are invested solely in one stock (the x 6 LP 7 corresponding four stocks). Portfolio 1 to 4 are therefore single-stock 2 x 70 portfolios b. Portfolio 5: one-quarter of the funds are invested in each stock Sonighest Portfolio 6: one-half of the funds are invested in the stock with the highest 55 low vol average return and one-half in the stock with the lower volatility d. Portfolio 7: 20% of the funds are invested in each stock and the 5-year government bond. e Portfolio 8: 150% of the funds are invested in the two stocks with the highest Sharpe ratio, 30% of the extra funds are generated by short-selling the stock with the lowest Sharpe ratio and 20% of the extra funds come from a loan (for which the interest rate is equal to the 5-year government bond yield). er volatility(of differen 3. Compute the expected weekly return and the corresponding weekly volatility of the returns of each portfolio (from Portfolio 1 to Portfolio 8). Discuss the performance of each portfolio in terms of return, risk and Sharpe ratio) and relates the discussion to their respective capital and asset allocation. Are any of the portfolios efficient? Which portfolio would you invest in and why? Explain and detail your answers. Support your answers with a graph in excel. Continue to work with weekly returns. Is there any combination of the four stocks that is superior to all portfolios above (i.e. Portfolios 1 to 8)? Illustrate and explain your answer with a graph in excel. Consider the case of two investors with a different degree of risk aversion. 5. Continue to work with weekly returns. Is there any combination of the government bond and the four stocks that is superior to all portfolios above (i.e., Portfolios 1 to 8 and the portfolio you may have constructed in question 4)? Explain and detail your answer. Illustrate it with a graph in excel. Consider the case of two investors with a different degree of risk aversion. If short-selling is not allowed, would it change your answer? 6. Download five years of weekly returns for an appropriate domestic equity market index. Given weekly return data on individual stocks, estimate the domestic beta coefficients for each stock, using simple regression analysis (OLS). Then, a. Estimate the beta coefficient of Portfolio 6, Portfolio 7, Portfolio 8 and the best portfolio you may have constructed in Question 4 or 5. Are each of these 1 If the stock with the highest average return is also the stock with the lower volatility, consider as second asset the stock with the second lower volatility Portfolios (four portfolios in total) aggressive? Defensive? Justify your answer and discuss the implications. b. Is there any evidence that Portfolio 8 and the best portfolio you here any evidence that these portfolios (i.e. Portfolio 6, Portfolio 7. 10 8 and the best portfolio you may have constructed in Question 4 or ere fairly valued /overvalued /undervalued? Justify and detail your mustrate it with a graph in excel. Was the domestic market index (as a passive portfolio) a better investment than the four portfolios? nine how much variation of each of the portfolios was explained by the stic market movements. Which portfolio is better diversified than the sr is this portfolio well-diversified? If yes, explain and detail your answer. ot, construct a better combination consisting of the four stocks if only diversification matters. 7. Considering now the MSCI All Countries W how the MSCI All Countries World index (in your respective local currency) proxy for the market portfolio and continuing to work with weekly returns, neck the possible similarities or differences in the betas and in the estimates of the expected returns for Portfolio 6, Portfolio 7, Portfolio 8 and the best portfolio you may have constructed in Question 4 or 5. What are the possible implications in terms of capital and asset allocation? b. How well do the domestic and the international single-index models capture the co-movements between the five stocks? What do you conclude in terms of systematic vs. firm-specific risk? c. What do you conclude in terms of market segmentation/integration? In terms of security valuation? 8. If you were to estimate the individual betas over a one-year period (i.e. from 01/11/2018 to 01/11/2019), using now daily returns, would you change significantly your views in question 6? Explain in detail your answer and the implications for investors, but do not make all the computations asked in question 6. Important remarks: You will work with realized (historical) returns and not with (ex-ante) expected returns. You therefore construct the efficient frontier and the optimal portfolio of the investor who actually predicted the precise averages of realized returns and who estimated a covariance matrix that materialized precisely in the actual realizations. This also implies that you could find negative average returns, but this is NOT the result of negative risk premiums, that are derived from expected returns. The written report accompanying the excel file must be clear and and justify what is done in the excel file and interpret the results computations, the Professor thus expects a clear interpretation mention your name in the excel file must be clear and comprehensive, explain excel file and interpret the results. In addition to pure us expects a clear interpretation of the results. Please
Step by Step Solution
There are 3 Steps involved in it

Get step-by-step solutions from verified subject matter experts