

Question: Each short answer question below can be answered with a few sentences.I strongly encourage you to think more than you write. 1.The table below displays
Each short answer question below can be answered with a few sentences.I strongly encourage you to think more than you write.
1.The table below displays output from a crosstabulation of 2 variables: (a) average that young adult drank in the past year, and (b) race of the respondent.The subsequent table reports data from a chi-square analysis.The percentages in the crosstabulation are row percentages.explain a paragraph describing the findings and conclusions displayed within the crosstabulation and chi-square test table focusing on the extreme categories of "those who did not drink in the past 12 months" and "those that drank daily."
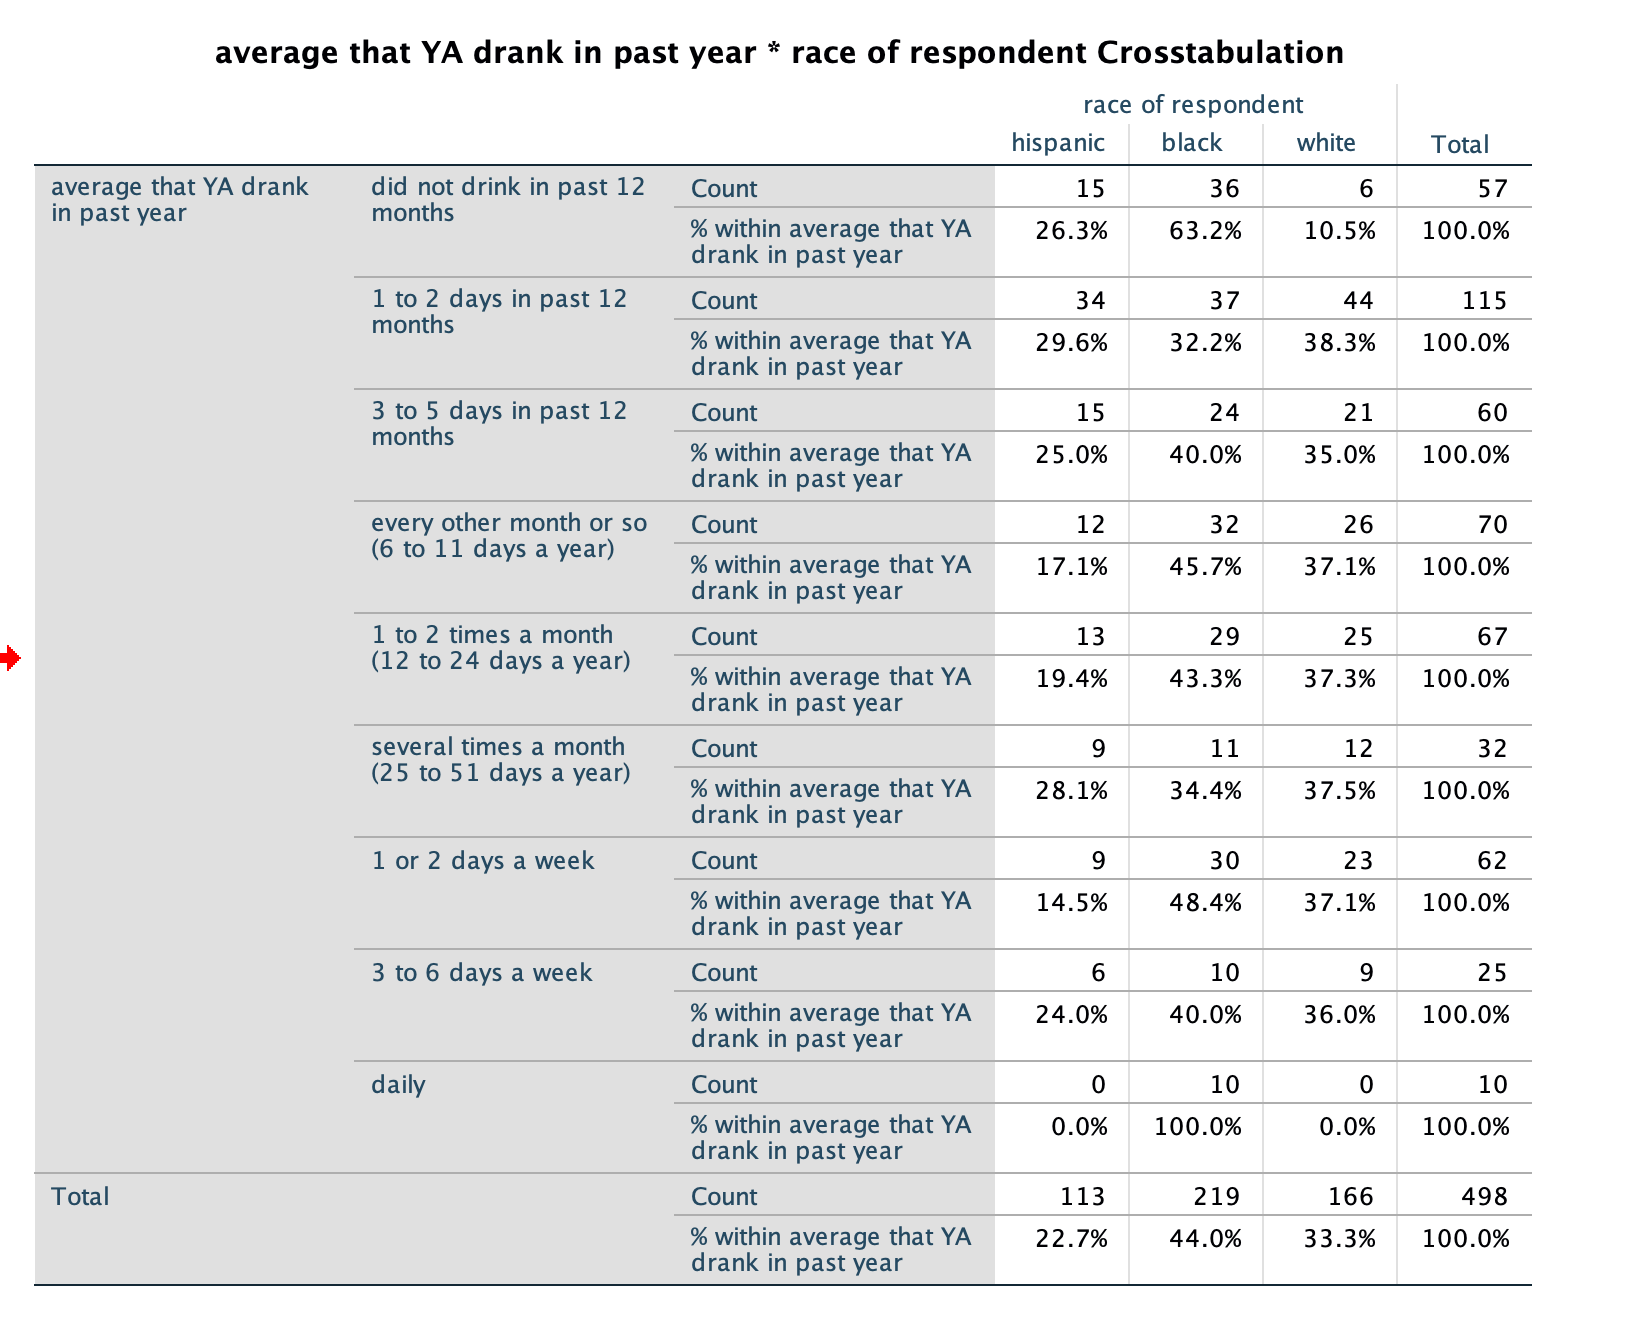
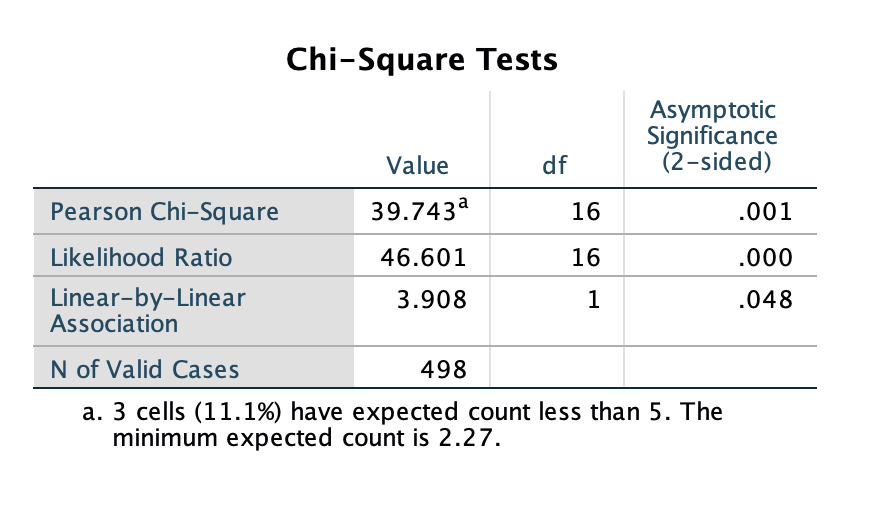
average that YA drank in past year * race of respondent Crosstabulation race of respondent hispanic black white Total average that YA drank 15 6 in past year did not drink in past 12 Count 36 57 months % within average that YA drank in past year 26.3% 63.2% 10.5% 100.0% 1 to 2 days in past 12 Count 34 44 months 37 115 % within average that YA drank in past year 29.6% 32.2% 38.3% 100.0% 3 to 5 days in past 12 Count 15 24 21 60 months % within average that YA drank in past year 25.0% 40.0% 35.0% 100.0% every other month or so (6 to 1 1 days a year) Count 12 32 26 70 % within average that YA 17.1% 37.1% drank in past year 45.7% 100.0% 1 to 2 times a month (12 to 24 days a year) Count 13 29 25 67 % within average that YA 19.4% 43.3% 37.3% 100.0% drank in past year several times a month Count 9 11 (25 to 51 days a year) 12 32 % within average that YA drank in past year 28.1% 34.4% 37.5% 100.0% 1 or 2 days a week Count 9 30 23 62 % within average that YA drank in past year 14.5% 48.4% 37.1% 100.0% 3 to 6 days a week Count 6 10 9 25 % within average that YA drank in past year 24.0% 40.0% 36.0% 100.0% daily Count 0 0 10 % within average that YA 0.0% drank in past year 100.0% 0.0% 100.0% Total Count 113 219 166 867 % within average that YA 22.7% 44.0% 33.3% 100.0% drank in past yearChi-Square Tests Asymptotic Significance Value df (2-sided) Pearson Chi-Square 39.743a 16 .001 Likelihood Ratio 46.601 16 000 Linear-by-Linear Association 3.908 H .048 N of Valid Cases 498 a. 3 cells (11.1%) have expected count less than 5. The minimum expected count is 2.27
Step by Step Solution
There are 3 Steps involved in it

Get step-by-step solutions from verified subject matter experts