

Question: Each state collects information on every birth that occurs within its borders. The following data give the 2008 birth rates (number of births per
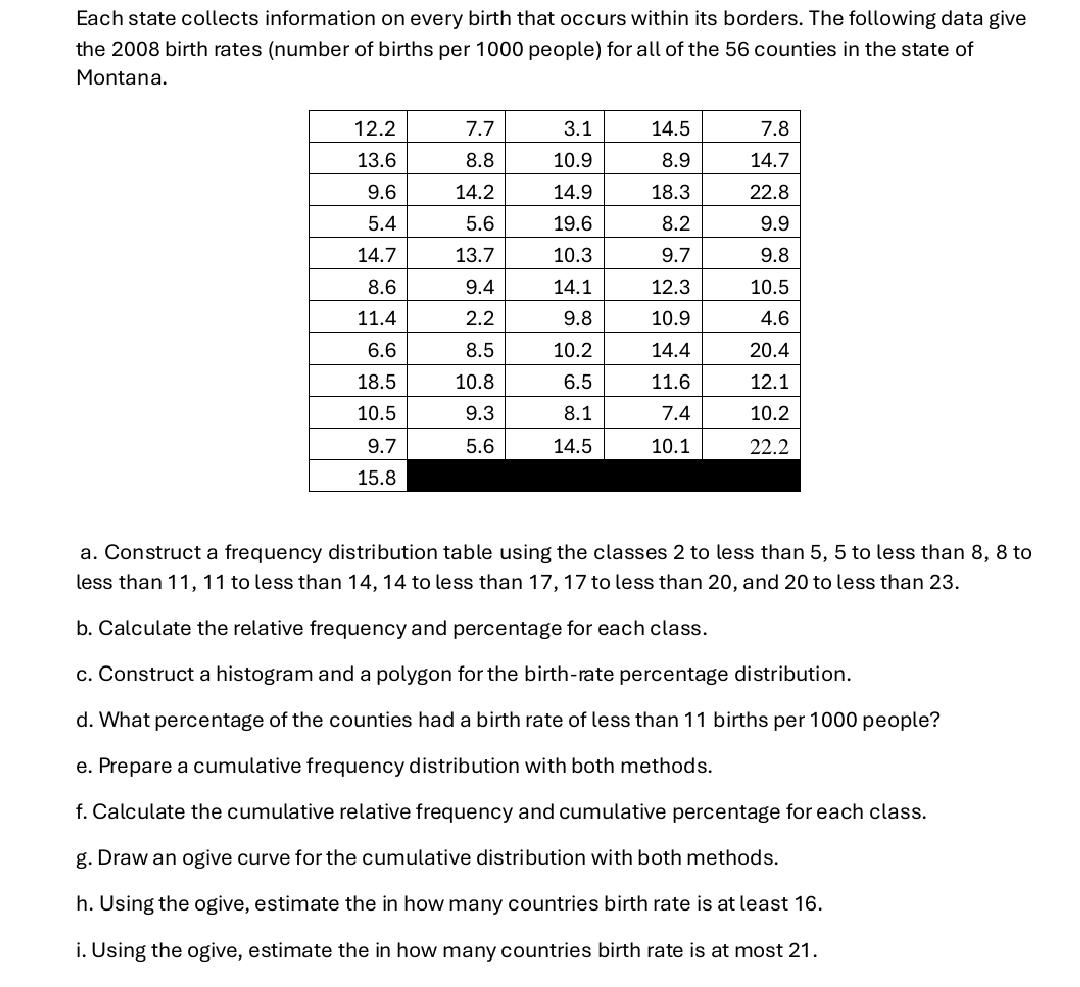
Each state collects information on every birth that occurs within its borders. The following data give the 2008 birth rates (number of births per 1000 people) for all of the 56 counties in the state of Montana. 12.2 7.7 3.1 14.5 7.8 13.6 8.8 10.9 8.9 14.7 9.6 14.2 14.9 18.3 22.8 5.4 5.6 19.6 8.2 9.9 14.7 13.7 10.3 9.7 9.8 8.6 9.4 14.1 12.3 10.5 11.4 2.2 9.8 10.9 4.6 6.6 8.5 10.2 14.4 20.4 18.5 10.8 6.5 11.6 12.1 10.5 9.3 8.1 7.4 10.2 9.7 15.8 5.6 14.5 10.1 22.2 a. Construct a frequency distribution table using the classes 2 to less than 5, 5 to less than 8, 8 to less than 11, 11 to less than 14, 14 to less than 17, 17 to less than 20, and 20 to less than 23. b. Calculate the relative frequency and percentage for each class. c. Construct a histogram and a polygon for the birth-rate percentage distribution. d. What percentage of the counties had a birth rate of less than 11 births per 1000 people? e. Prepare a cumulative frequency distribution with both methods. f. Calculate the cumulative relative frequency and cumulative percentage for each class. g. Draw an ogive curve for the cumulative distribution with both methods. h. Using the ogive, estimate the in how many countries birth rate is at least 16. i. Using the ogive, estimate the in how many countries birth rate is at most 21.
Step by Step Solution
There are 3 Steps involved in it
To solve this we need to work through each part step by step a Construct a frequency distribution table Classes 2 to less than 5 5 to less than 8 8 to ... View full answer

Get step-by-step solutions from verified subject matter experts